Fig. 14
Download original image
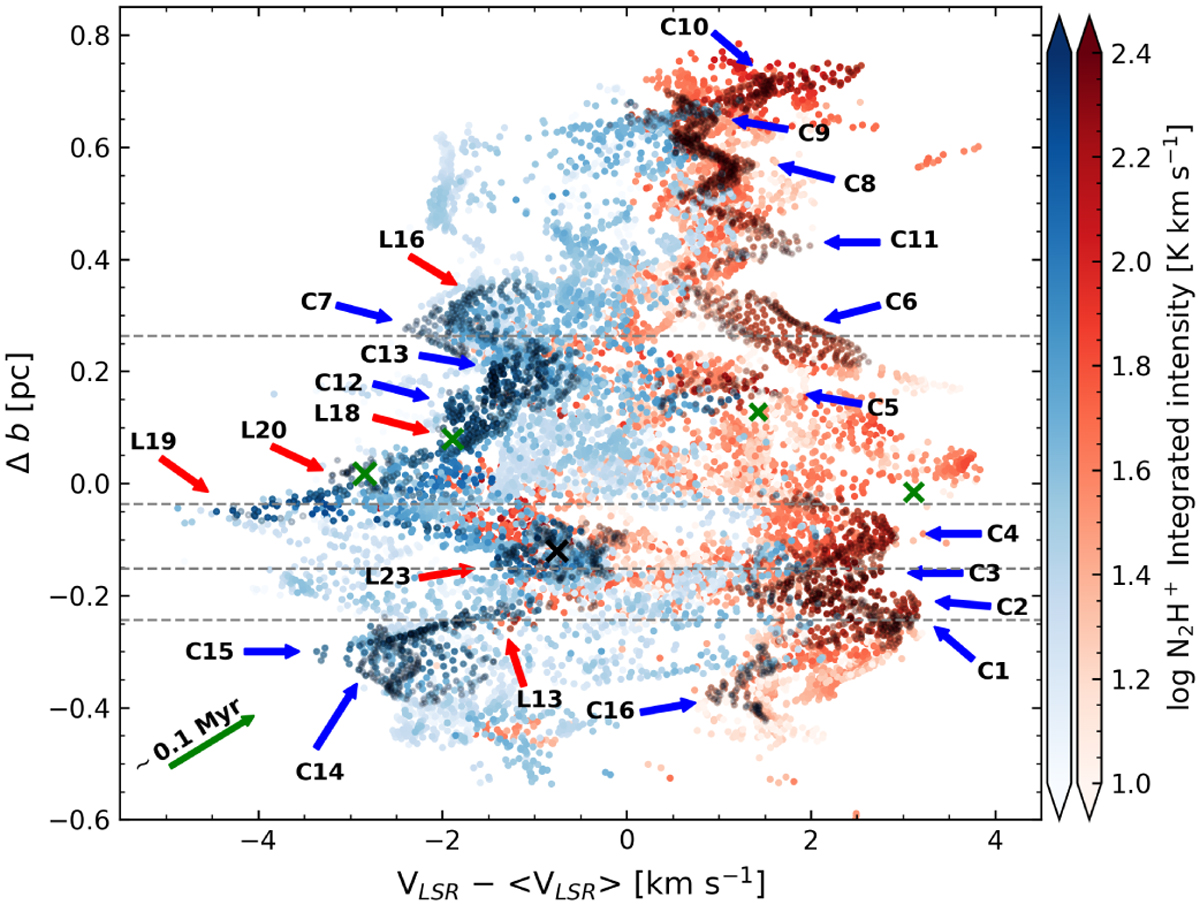
PV diagram of the blue (blue color bar) and red (red color bar) velocity components seen in N2H+ (1–0). The dark points highlight the PV features observed. The blue arrows represent the location of the 16 PV features of candidates cores under the 1.3 mm band detection limit (see Table E.1). The red arrows indicate the location in the PV diagram of PV features associated with the dense cores (Louvet et al. 2024, see Table E.1). The markers and dashed lines are the same as in Fig. 11. The green arrow represents a velocity gradient of 10 km s−1 pc−1, which correspond to a timescale of 0.1 Myr.
Current usage metrics show cumulative count of Article Views (full-text article views including HTML views, PDF and ePub downloads, according to the available data) and Abstracts Views on Vision4Press platform.
Data correspond to usage on the plateform after 2015. The current usage metrics is available 48-96 hours after online publication and is updated daily on week days.
Initial download of the metrics may take a while.