Fig. 13
Download original image
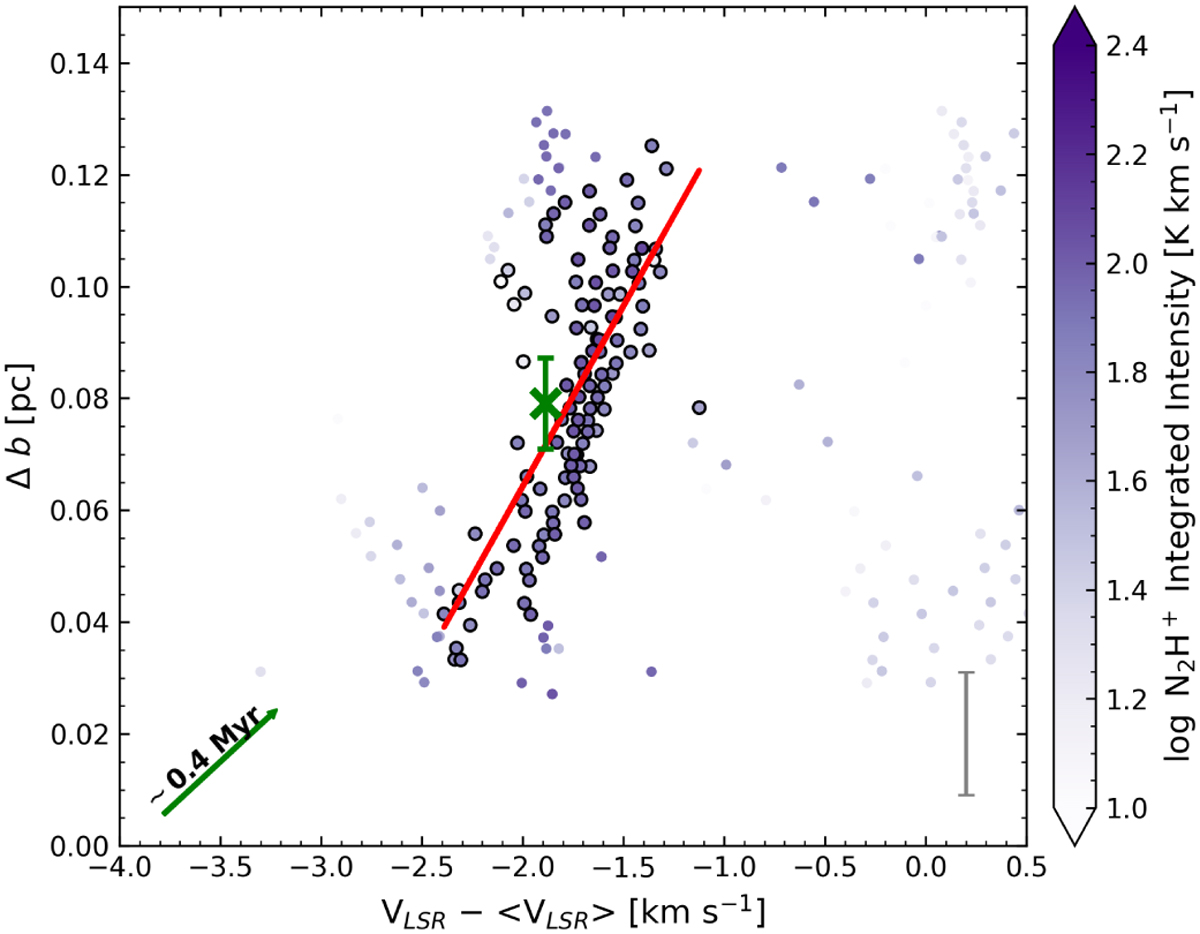
PV diagram of a single core (L18 in Table E.1) from the catalog of Louvet et al. (2024). The PV feature outlines what we define as a straight shape. The black outlined points show the points used to generate the linear fit of the velocity gradient. The red line represents the linear fit of the velocity gradient. The green × marker indicates the position (Louvet et al. 2024) and velocity of the dense core measured in DCN (see Table F.9 in Cunningham et al. 2023), while the green bar indicates the projected dense core size. The gray error bar represents the beam size of the N2H+ data. The green arrow represents a velocity gradient of 25 km s−1 pc−1, which correspond to a timescale of ~0.4 Myr.
Current usage metrics show cumulative count of Article Views (full-text article views including HTML views, PDF and ePub downloads, according to the available data) and Abstracts Views on Vision4Press platform.
Data correspond to usage on the plateform after 2015. The current usage metrics is available 48-96 hours after online publication and is updated daily on week days.
Initial download of the metrics may take a while.