Fig. 12
Download original image
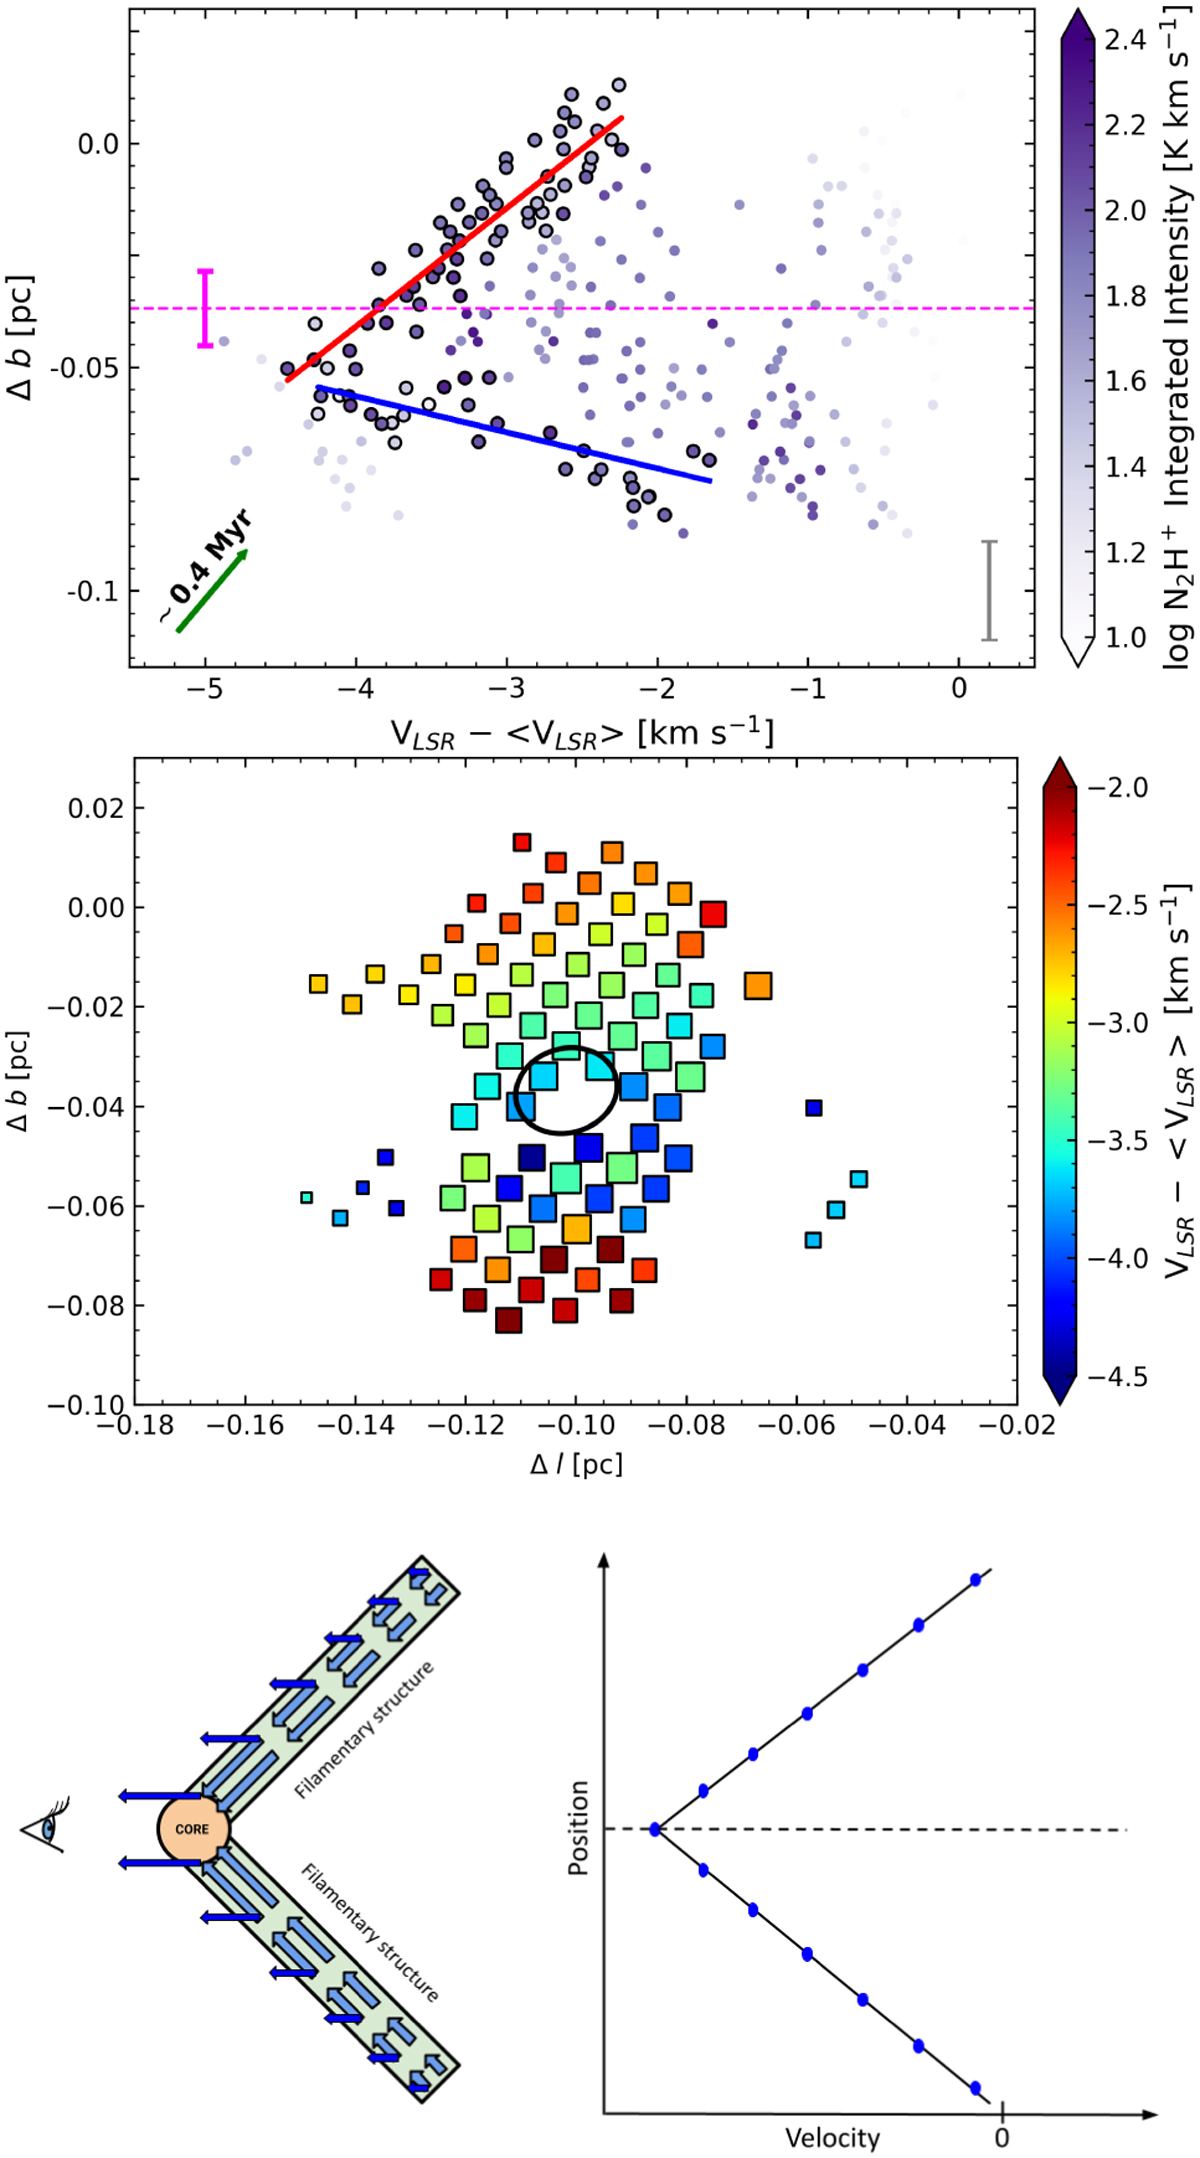
Top: PV diagram of the most prominent V-shape (L19 in Fig. 11). The black outlined points show the points used in order to generate the linear fits of the velocity gradients. The red and blue lines represent the upper and lower VG, respectively, which converge at ~ 0.015 pc below the central position of the dense core. The magenta error bar represents the projected size of the dense core (Louvet et al. 2024), while the horizontal dashed line represents the position of the dense core. The color bar shows the integrated intensity of N2H+ (1–0) levels. The gray error bar represents the beam size of the N2H+ data. The green arrow represents a velocity gradient of 25 km s−1 pc−1, which corresponds to a timescale of ~0.4 Myr. Middle: Position-position diagram of the most prominent V-shape. The squares represent the points used for the linear fit (top figure). The size of the squares correspond to the integrated intensity of each spectrum, while the ellipse indicates the position and size of the dense core (L19 in Fig. 11). Bottom right: Proposed model for the observed PV features as V-shapes (see also Fig. 12 in Henshaw et al. 2014 and Álvarez-Gutiérrez et al. 2024). Bottom left: inflowing filamentary structure. The light blue and blue arrows represent the velocity magnitude of the gas and the radial component of the gas velocity, respectively. Right: PV diagram of the model.
Current usage metrics show cumulative count of Article Views (full-text article views including HTML views, PDF and ePub downloads, according to the available data) and Abstracts Views on Vision4Press platform.
Data correspond to usage on the plateform after 2015. The current usage metrics is available 48-96 hours after online publication and is updated daily on week days.
Initial download of the metrics may take a while.