Fig. 11
Download original image
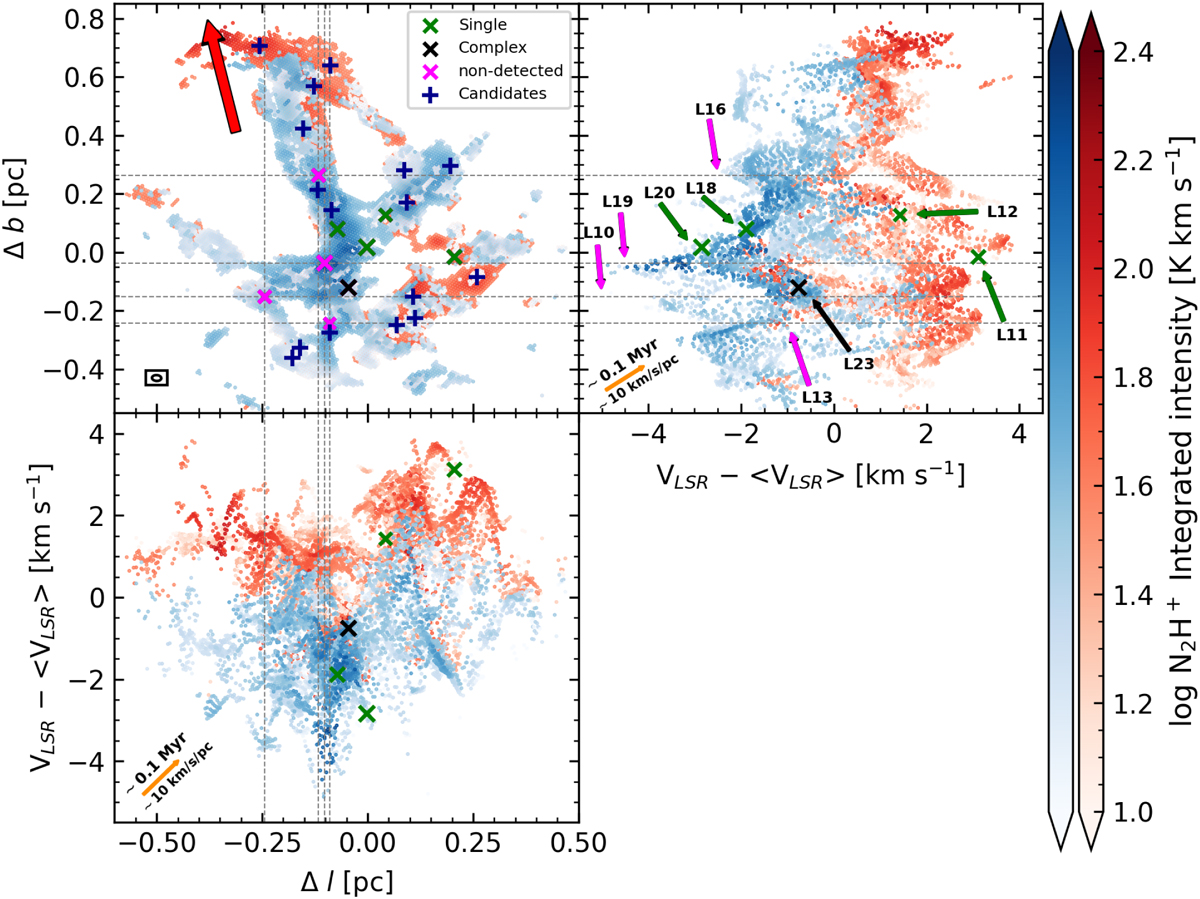
Integrated intensity and PV diagrams of the blue (blue color bar) and red (red color bar) velocity components seen in N2H+ (1–0). Top left: spatial distribution of N2H+ (1–0) emission in G351.77. The green, black, and magenta × markers indicate the positions of the 9 out of the 18 (see Sect. 5.1) dense cores (Louvet et al. 2024), where each color represents the DCN spectral classification: single, complex, and non-detected, respectively (Cunningham et al. 2023). The + markers indicate the position of the 16 core candidates, proposed on the basis on the N2H+ PV features observed at scales of ~0.1 pc (see Sect. 5.1 and Table E.1). Dashed lines indicate the positions of the four dense cores that do not have measurable velocities. The red arrow indicates the direction of the Mother Filament. The ellipse in the bottom left represents the beam size of the N2H+ data. Top right and bottom left: PV diagrams along the two perpendicular directions. Top right: the colored arrows indicate the position of the dense cores and their ID in Table 3. We observe multiple structures, such as V-shapes and Straight structures (see text) along the filaments, some associated with dense cores in both position and velocity. The orange arrows represent a velocity gradient of 10 km s−1 pc−1 ≈ 0.1 Myr.
Current usage metrics show cumulative count of Article Views (full-text article views including HTML views, PDF and ePub downloads, according to the available data) and Abstracts Views on Vision4Press platform.
Data correspond to usage on the plateform after 2015. The current usage metrics is available 48-96 hours after online publication and is updated daily on week days.
Initial download of the metrics may take a while.