Fig. 10
Download original image
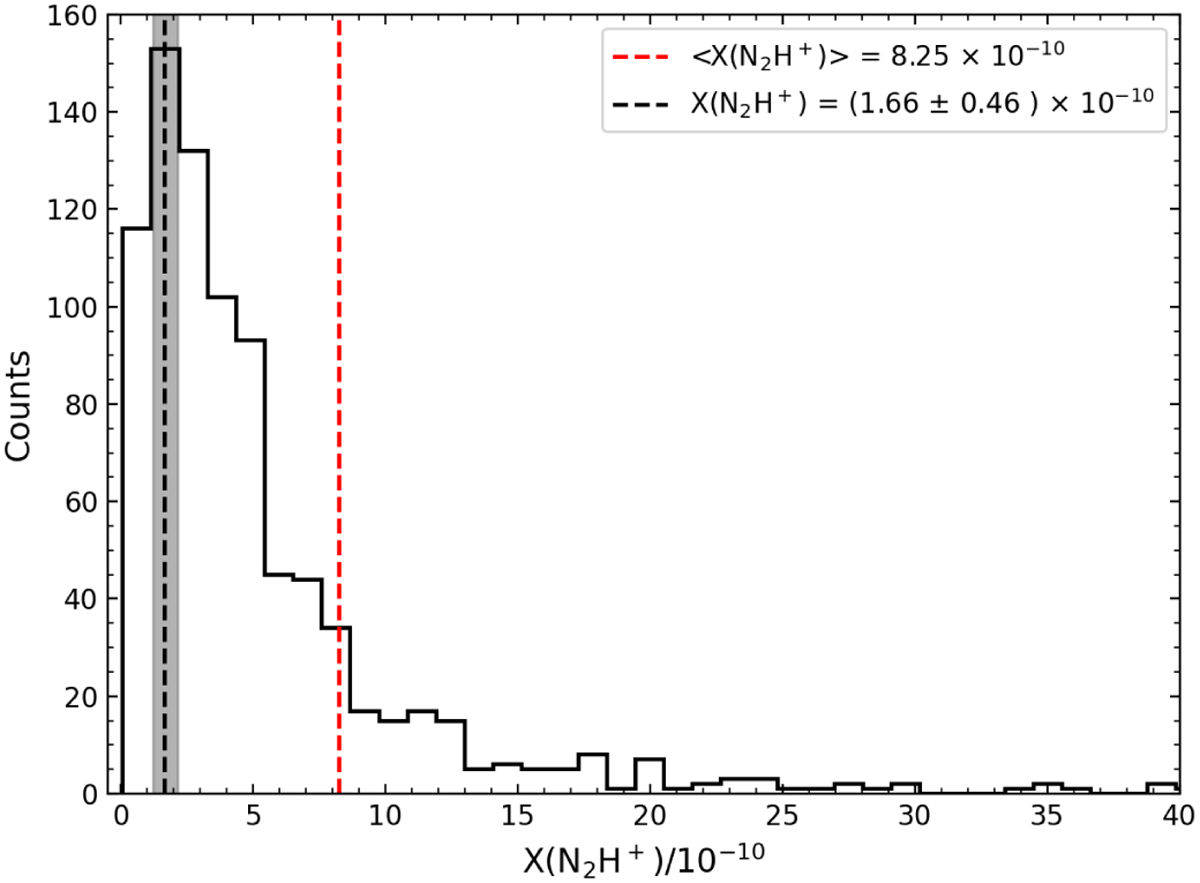
Relative abundance X(N2H+) distribution in the G351.77 protocluster zone. The dashed red line represents the mean of the distribution. The dashed black line represents the mean inside the most prominent bin of the distribution. The shaded region represents the estimated error around the mode.
Current usage metrics show cumulative count of Article Views (full-text article views including HTML views, PDF and ePub downloads, according to the available data) and Abstracts Views on Vision4Press platform.
Data correspond to usage on the plateform after 2015. The current usage metrics is available 48-96 hours after online publication and is updated daily on week days.
Initial download of the metrics may take a while.