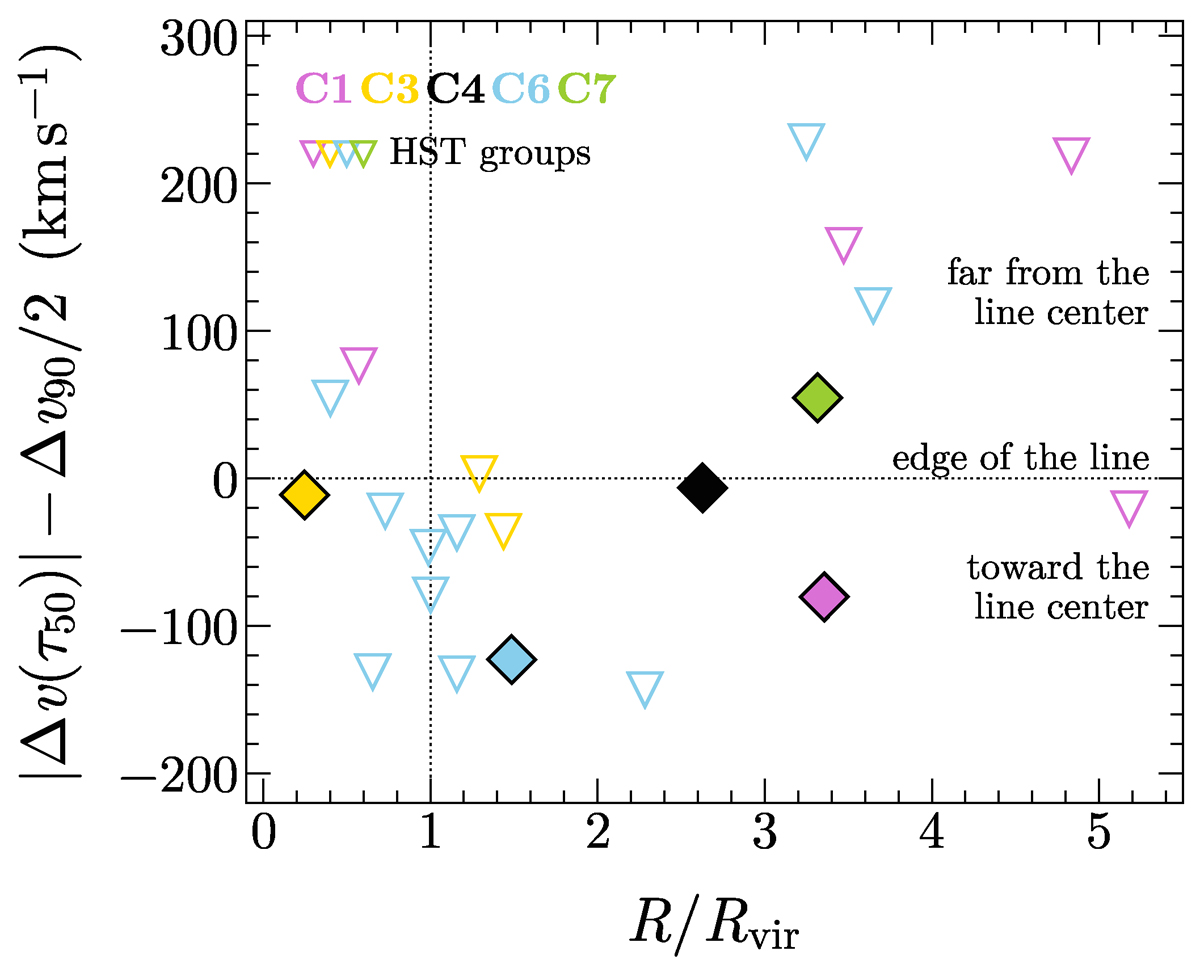
Fig. 8.
Download original image
Phase-space diagram of the galaxies identified with ALMA and of the other group members associated with quasar absorbers. The vertical axis reports the difference between the velocity shift from the absorption line center, measured from the τ50 wavelength (Δv(τ50)), and half of the Δv90 of the absorption profile. Negative values indicate that the galaxy systemic is near to the center of the absorption profile, while positive ones correspond to galaxies at the redshift of which no absorption is detected. The horizontal axis shows the galaxy impact parameters normalized by their virial radius (Rvir). The markers are color-coded as in Fig. 6.
Current usage metrics show cumulative count of Article Views (full-text article views including HTML views, PDF and ePub downloads, according to the available data) and Abstracts Views on Vision4Press platform.
Data correspond to usage on the plateform after 2015. The current usage metrics is available 48-96 hours after online publication and is updated daily on week days.
Initial download of the metrics may take a while.