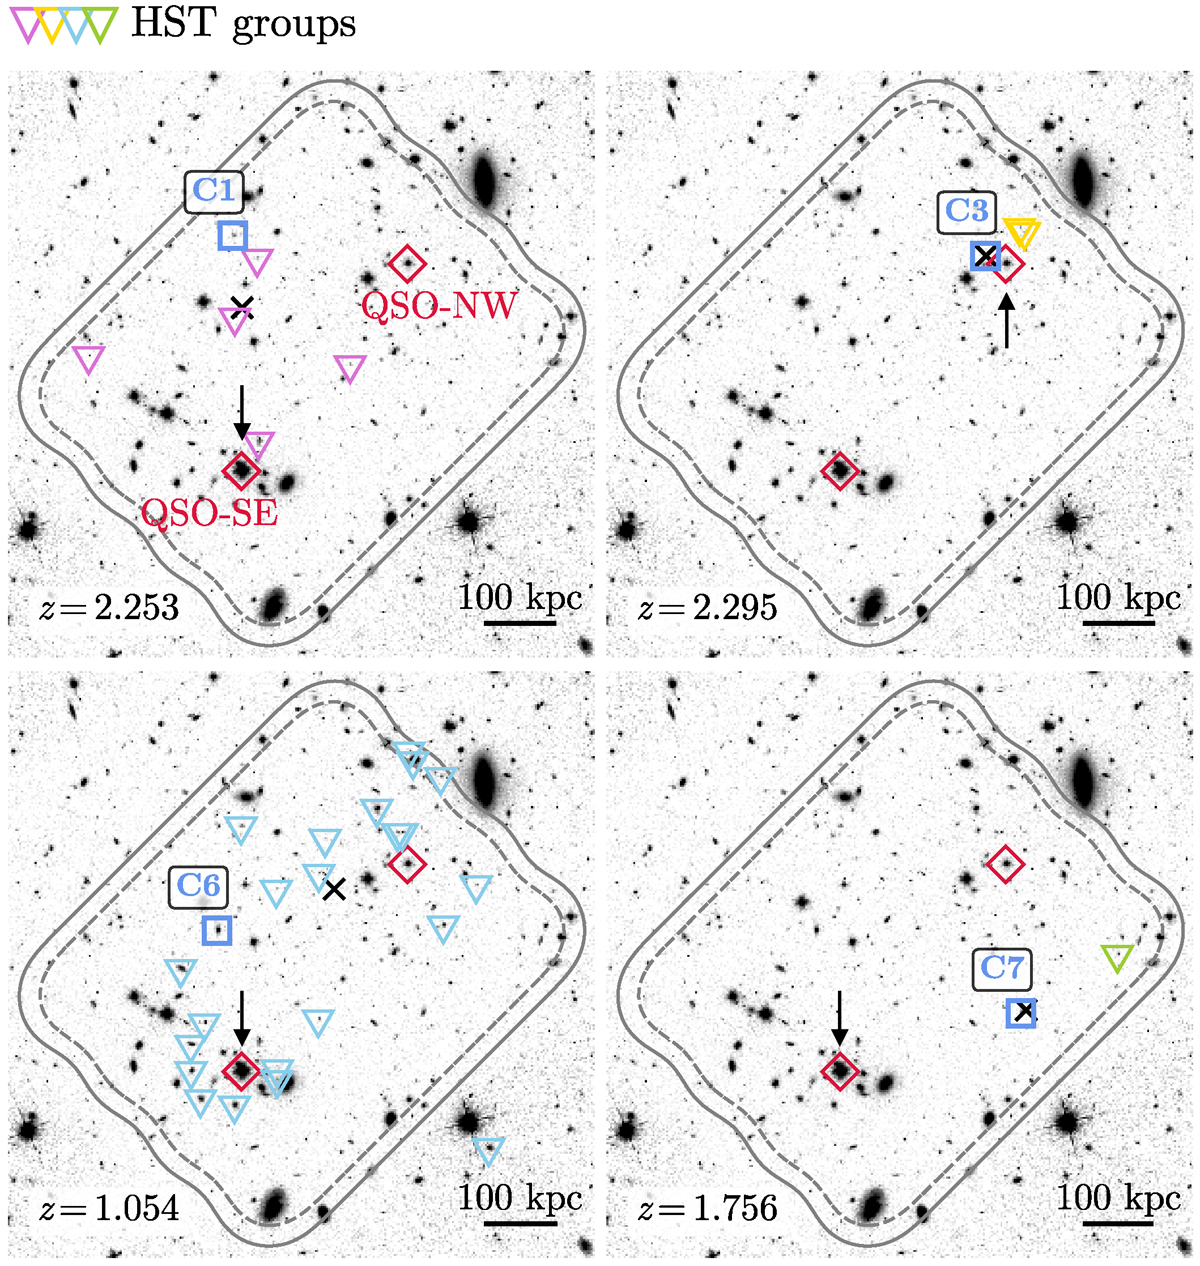
Fig. 7.
Download original image
Groups of galaxies around ALMA sources (blue squares). The colored triangles indicate the HST-selected galaxies belonging to the same group found around the redshift of ALMA sources (bottom left corner). The two quasars in the MUDF are labeled with red diamonds, the black arrow indicates the QSO sightline in which absorption at the redshift of each group is detected. The black crosses mark the projected location of the galaxy stellar mass-weighted barycenter of the groups. The gray solid and dashed lines report the PB response at 0.3 and 0.5, respectively, of the ALMA band 6 mosaic.
Current usage metrics show cumulative count of Article Views (full-text article views including HTML views, PDF and ePub downloads, according to the available data) and Abstracts Views on Vision4Press platform.
Data correspond to usage on the plateform after 2015. The current usage metrics is available 48-96 hours after online publication and is updated daily on week days.
Initial download of the metrics may take a while.