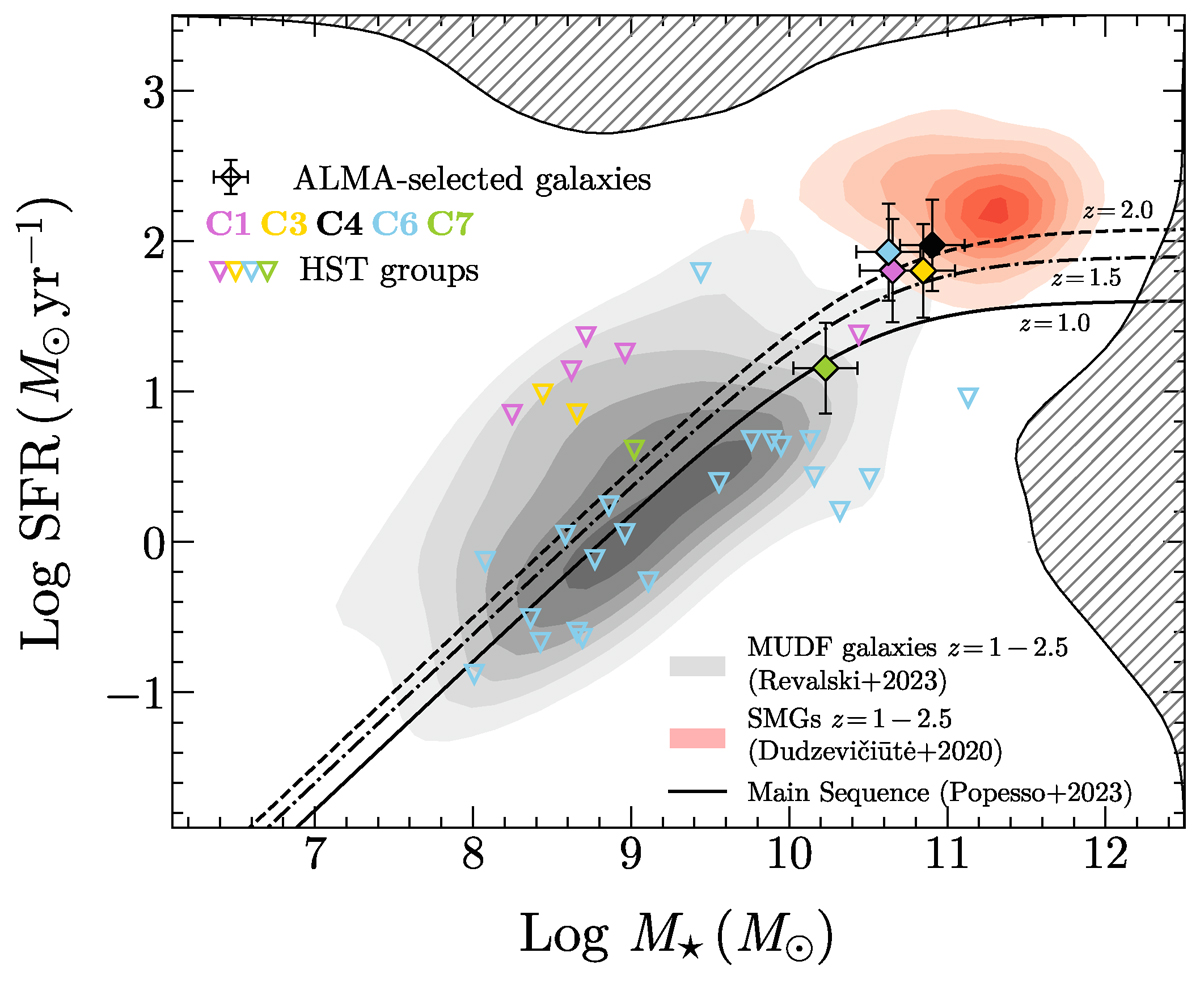
Fig. 6.
Download original image
Star formation rate-stellar mass diagram of galaxies detected in the MUDF. The gray density contours show the distribution of all galaxies selected with HST in the rest-frame optical/UV at z∼1−2. The marginalized distributions of M★ and SFR are also shown on the top and right axis, respectively. The red density contours report the sample of SMG with photometric redshift within 1≤z≤2.5 from Dudzevičiūtė et al. (2020). The ALMA-selected galaxies with properties derived from SED modeling are reported with diamonds. Colored triangles mark the HST-selected group galaxies associated with the same absorption system of each ALMA-selected galaxy. The star-forming main sequence at z∼1−2 from Popesso et al. (2023) is also shown.
Current usage metrics show cumulative count of Article Views (full-text article views including HTML views, PDF and ePub downloads, according to the available data) and Abstracts Views on Vision4Press platform.
Data correspond to usage on the plateform after 2015. The current usage metrics is available 48-96 hours after online publication and is updated daily on week days.
Initial download of the metrics may take a while.