Fig. 5.
Download original image
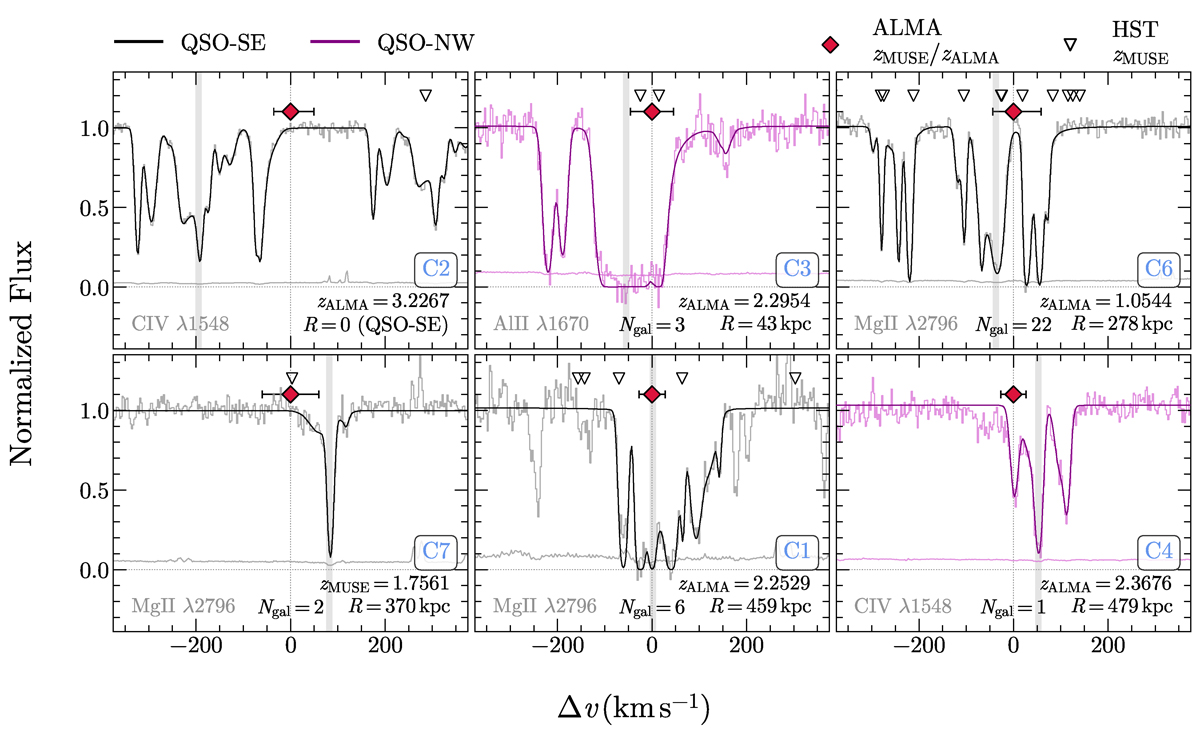
Connection between ALMA-selected galaxies and absorption systems in the spectra of the QSO-SE (black) and -NW (purple). The line-of-sight separations are centered on the redshift of the ALMA-selected galaxies. The vertical gray band indicates the velocity at which the optical depth of the absorption is 50% of the total (τ50). The transitions shown (C IV λ1548, Al II λ1670, and Mg II λ2796) are limited to the strongest lines among the multiple metals associated to each galaxy. Galaxies selected with ALMA are indicated by red diamonds with errorbars reporting uncertainties on their redshift measurements. The panels are ordered (from the top left to the bottom right panel) for increasing sky-projected separation (R) from the QSO sightline along which the absorption is detected. HST-selected galaxies linked to the same absorbers are shown with black triangles. The number of galaxies (Ngal) associated to each group (see, Sect. 5.3) is also reported.
Current usage metrics show cumulative count of Article Views (full-text article views including HTML views, PDF and ePub downloads, according to the available data) and Abstracts Views on Vision4Press platform.
Data correspond to usage on the plateform after 2015. The current usage metrics is available 48-96 hours after online publication and is updated daily on week days.
Initial download of the metrics may take a while.