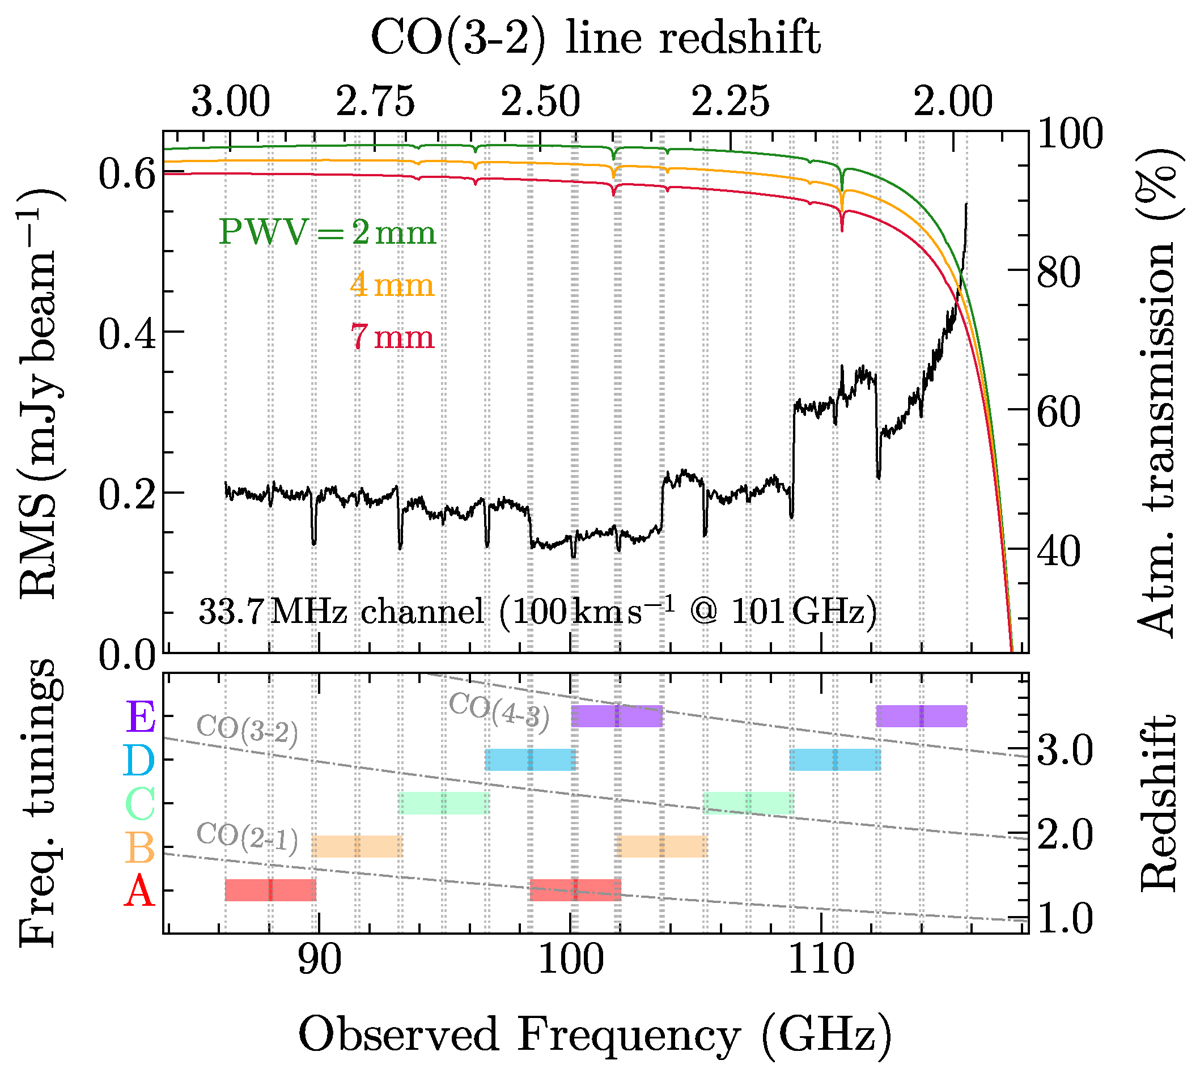
Fig. 2.
Download original image
Sensitivity (RMS) of the ALMA band 3 spectral scans across the covered frequency range. Top panel: The colored curves and the right axis report the atmospheric transmission from the ALMA site at different levels of PWV obtained using plotAtmosphere task in the CASA analysisUtils package (Hunter et al. 2023b). The top axis reports the expected redshift of the CO(3–2) line. Bottom panel: Disposition of SPWs in the four frequency tunings. Vertical dotted lines indicate the edges of the SPWs. The maximum sensitivity is achieved within z≈2.35−2.5 where two SPWs in different frequency tunings overlap. The right axis reports the redshift of the various CO transitions (dash-dotted lines) covered by the spectral scan within z≃1−4.
Current usage metrics show cumulative count of Article Views (full-text article views including HTML views, PDF and ePub downloads, according to the available data) and Abstracts Views on Vision4Press platform.
Data correspond to usage on the plateform after 2015. The current usage metrics is available 48-96 hours after online publication and is updated daily on week days.
Initial download of the metrics may take a while.