Fig. A.2.
Download original image
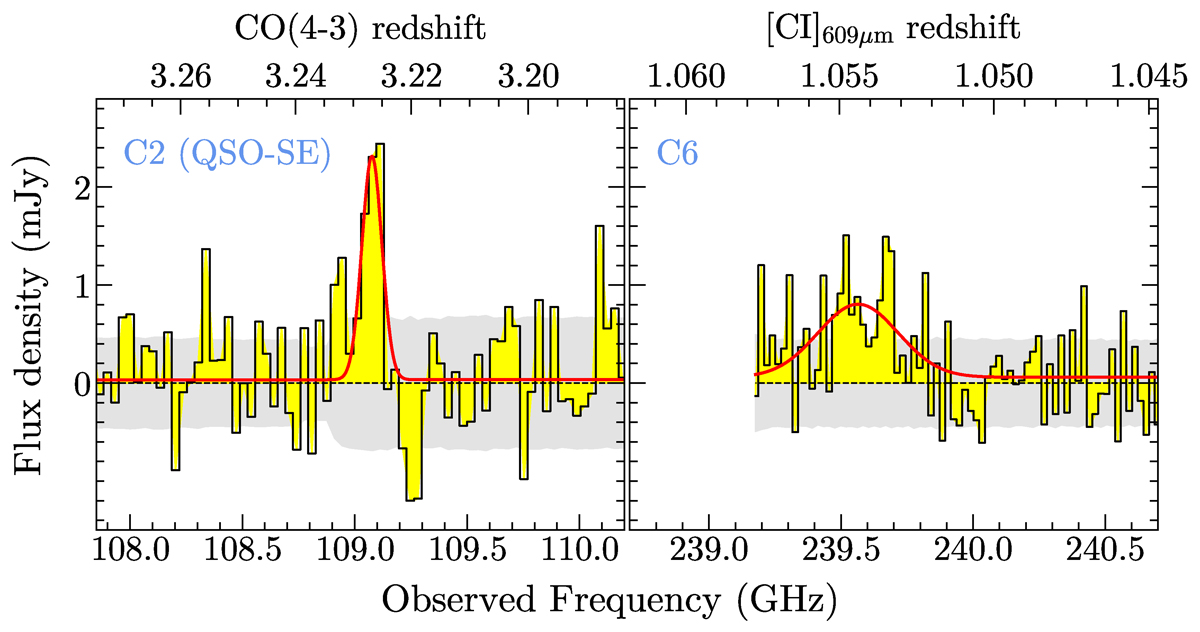
Spectra of additional line emitters identified in ALMA datacubes. Left panel: CO(4–3) line of C2 (QSO-SE) detected in the ALMA band 3 spectral scan of C4, corrected for the PB response. Right panel: [CI]609 μm line of C6 identified in the ALMA band 6 datacube. Data and the best-fit model are shown in yellow and red, respectively. The ±1σ RMS noise range of the data is indicated by the gray shaded area. The top scales report the expected line redshifts.
Current usage metrics show cumulative count of Article Views (full-text article views including HTML views, PDF and ePub downloads, according to the available data) and Abstracts Views on Vision4Press platform.
Data correspond to usage on the plateform after 2015. The current usage metrics is available 48-96 hours after online publication and is updated daily on week days.
Initial download of the metrics may take a while.