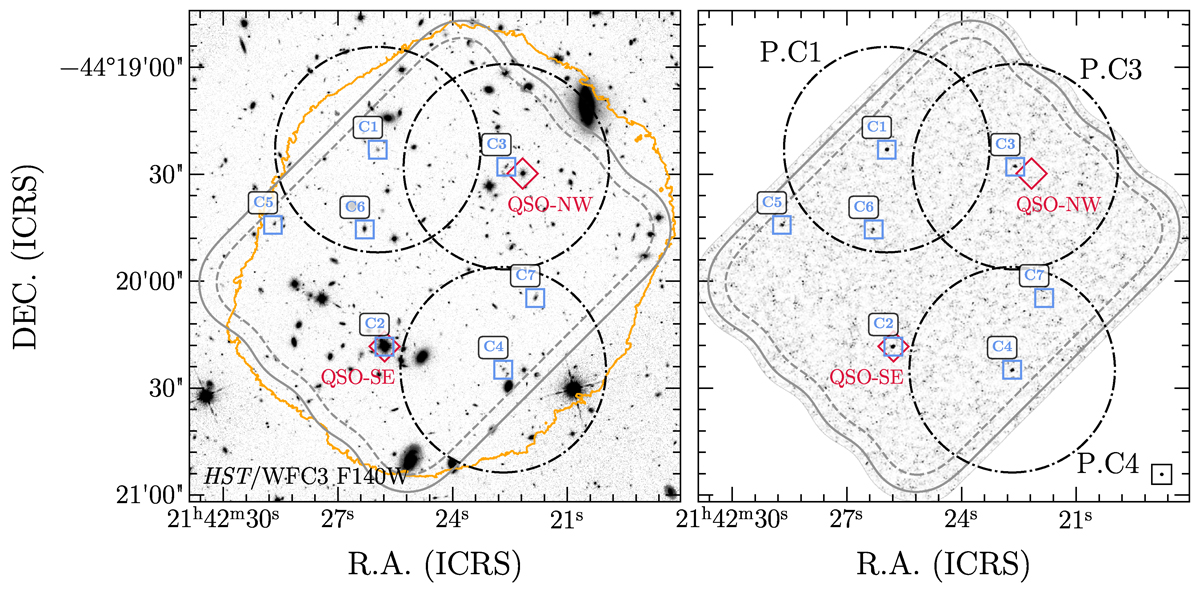
Fig. 1.
Download original image
Footprints of ALMA observations toward the MUDF. Left panel: The background shows the HST/WFC3 F140W image, and the gray lines show the PB response of the ALMA band 6 mosaic at 30% and 50% (solid and dashed lines, respectively). The orange line indicates the region observed by VLT/MUSE with >3 hours of exposure time. Red diamonds indicate the MUDF quasar pair. The blue squares with labels indicate the high-fidelity ALMA-selected sources extracted from the 1.2 mm continuum image. The dot-dashed black circles show the ALMA pointings of the band 3 spectral scans toward three individual sources (P.C1, P.C3, and P.C4). The diameter of the circles indicates the HPBW at 101 GHz. Right panel: ALMA band 6 continuum observations. The synthesized beam size is shown in the bottom right corner.
Current usage metrics show cumulative count of Article Views (full-text article views including HTML views, PDF and ePub downloads, according to the available data) and Abstracts Views on Vision4Press platform.
Data correspond to usage on the plateform after 2015. The current usage metrics is available 48-96 hours after online publication and is updated daily on week days.
Initial download of the metrics may take a while.