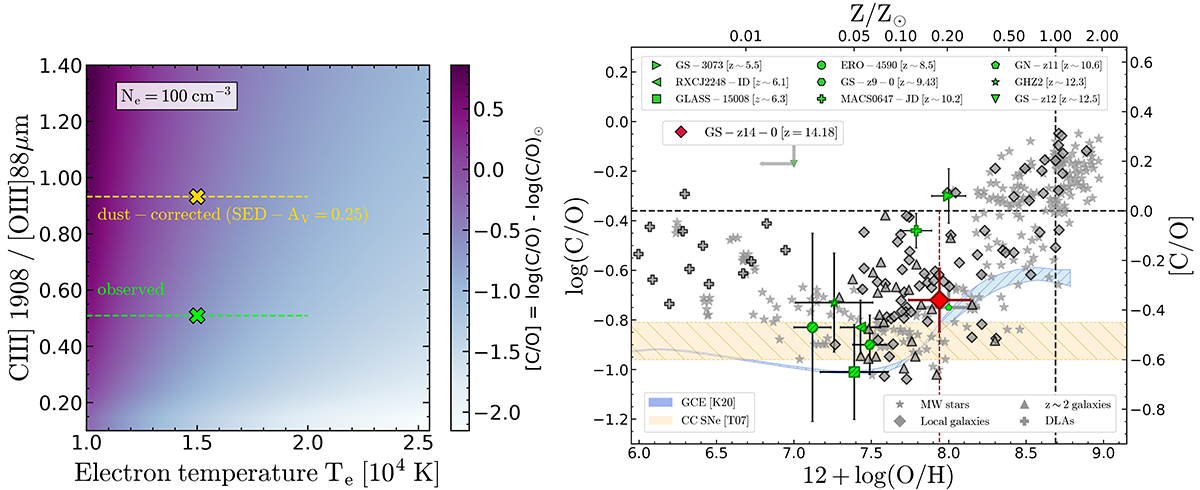
Fig. 7.
Download original image
Carbon-over-oxygen abundance for JADES-GS-z14-0. The left-hand panel shows how the final inferred C/O value changes as a function of the C III]/[O III]88 μm line ratio and of the electron temperature, Te, under our fiducial assumption of Ne = 100 cm−3. The observed and dust-corrected C III]/[O III]88 μm ratios for JADES-GS-z14-0 are marked in green and yellow, respectively. In the right-hand panel, we report our fiducial C/O measurement for JADES-GS-z14-0 on the C/O vs O/H diagram. The oxygen abundance is inferred from the best-fit prospector metallicity reported in Table 2. The C/O value measured in JADES-GS-z14-0 is consistent with pure enrichment from core-collapse Supernovae. We also report for comparison a sample of C/O measurements from JWST compiled from the literature, namely GS-z12 (z = 12.5; D’Eugenio et al. 2024a), GHZ2 (z = 12.34; Castellano et al. 2024), GN-z11 (z = 10.6; Cameron et al. 2024), MACS0647-JD (z = 10.2; Hsiao et al. 2024b), GS-z9-0 (z = 9.4; Curti et al. 2025), ERO-4590 (z = 8.5; Arellano-Córdova et al. 2022), RXCJ2248-ID (z = 6.11; Topping et al. 2024), GLASS-150008 (z = 6.23; Jones et al. 2023), GS-3073 (z = 5.5; Ji et al. 2024). The C/O vs O/H pattern predicted by Galactic Chemical Evolution models of Kobayashi et al. (2020) is shown in blue, whereas the C/O range allowed by the CC-SNe yields from Tominaga et al. (2007) is marked by the golden region.
Current usage metrics show cumulative count of Article Views (full-text article views including HTML views, PDF and ePub downloads, according to the available data) and Abstracts Views on Vision4Press platform.
Data correspond to usage on the plateform after 2015. The current usage metrics is available 48-96 hours after online publication and is updated daily on week days.
Initial download of the metrics may take a while.