Fig. 5.
Download original image
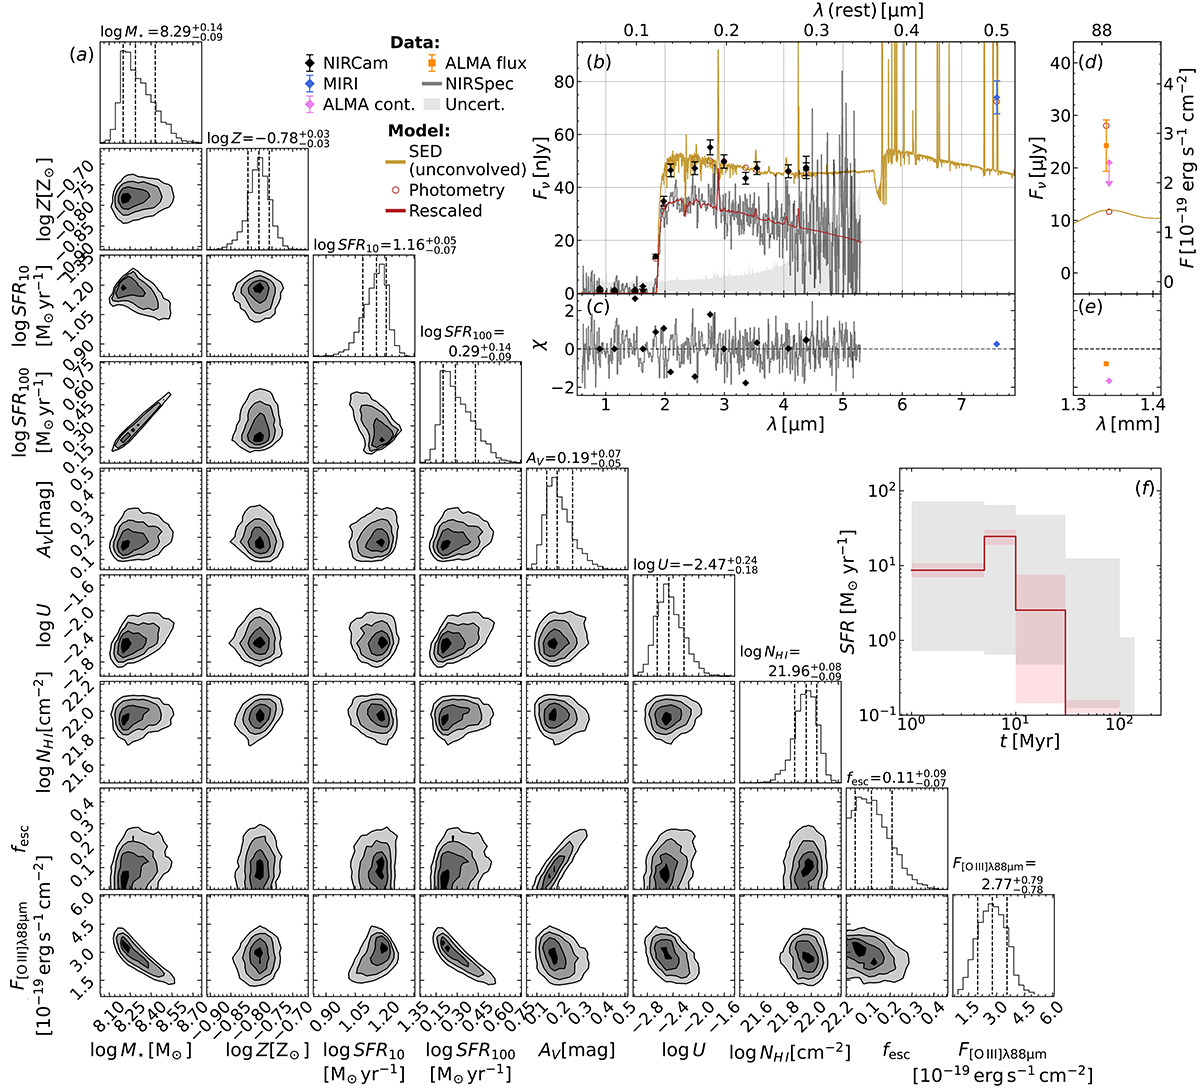
Summary of prospector SED model. Panel a: Triangle diagram with the marginalized posterior distribution over a subset of the model-free or dependent parameters (see Table 2 for a description of the parameters and their probability prior). Panel b: SED, including wide- and medium-band measured flux densities (diamonds), the spectrum (grey line with grey region as the uncertainty). NIRCam, MIRI and ALMA data are in black, blue and pink, respectively. Model predictions are red circles (flux densities) or the red line (spectrum). The sand-coloured line is the model SED without convolving to the spectral resolution fo the data. Panel c: Model residuals normalised by the uncertainties. Panel d: Same as panel b, but for the FIR region. The orange square is the ALMA [O III]flux. Panel e: Same as panel c, but for the FIR region. Panel f: Star-formation history (red), with the prior probability in grey.
Current usage metrics show cumulative count of Article Views (full-text article views including HTML views, PDF and ePub downloads, according to the available data) and Abstracts Views on Vision4Press platform.
Data correspond to usage on the plateform after 2015. The current usage metrics is available 48-96 hours after online publication and is updated daily on week days.
Initial download of the metrics may take a while.