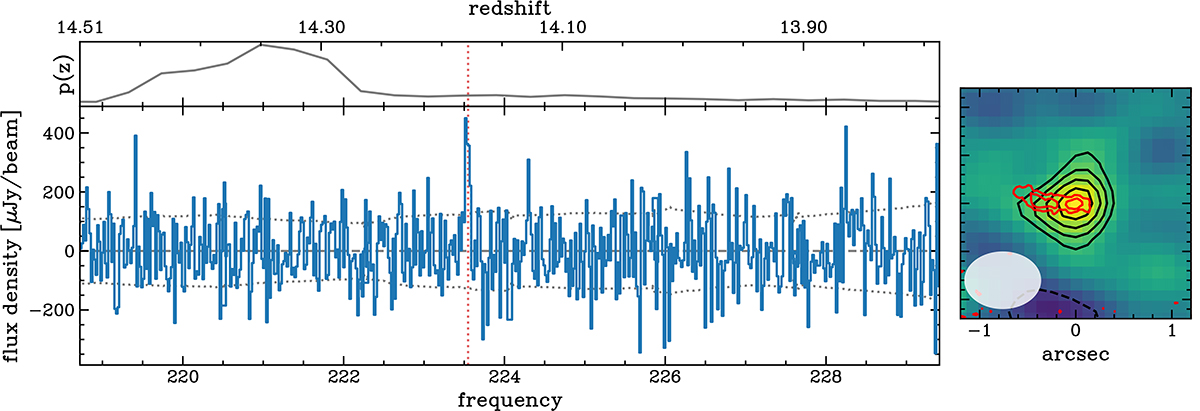
Fig. 1.
Download original image
[O III]88 μm spectrum (left) and flux map (right) of JADES-GS-z14-0. The top panel illustrates the redshift probability distribution determined from the JWST/NIRSpec data. The red vertical dotted line shows the redshift determined from the candidate C III] detection (Carniani et al. 2024). The black contours in the flux map show ±3, ±4, ±5, and ±6 σ of [O III]emission, while red contours correspond to the rest-frame UV emission from JWST/NIRCam F200W observations.
Current usage metrics show cumulative count of Article Views (full-text article views including HTML views, PDF and ePub downloads, according to the available data) and Abstracts Views on Vision4Press platform.
Data correspond to usage on the plateform after 2015. The current usage metrics is available 48-96 hours after online publication and is updated daily on week days.
Initial download of the metrics may take a while.