Open Access
Fig. 15
Download original image
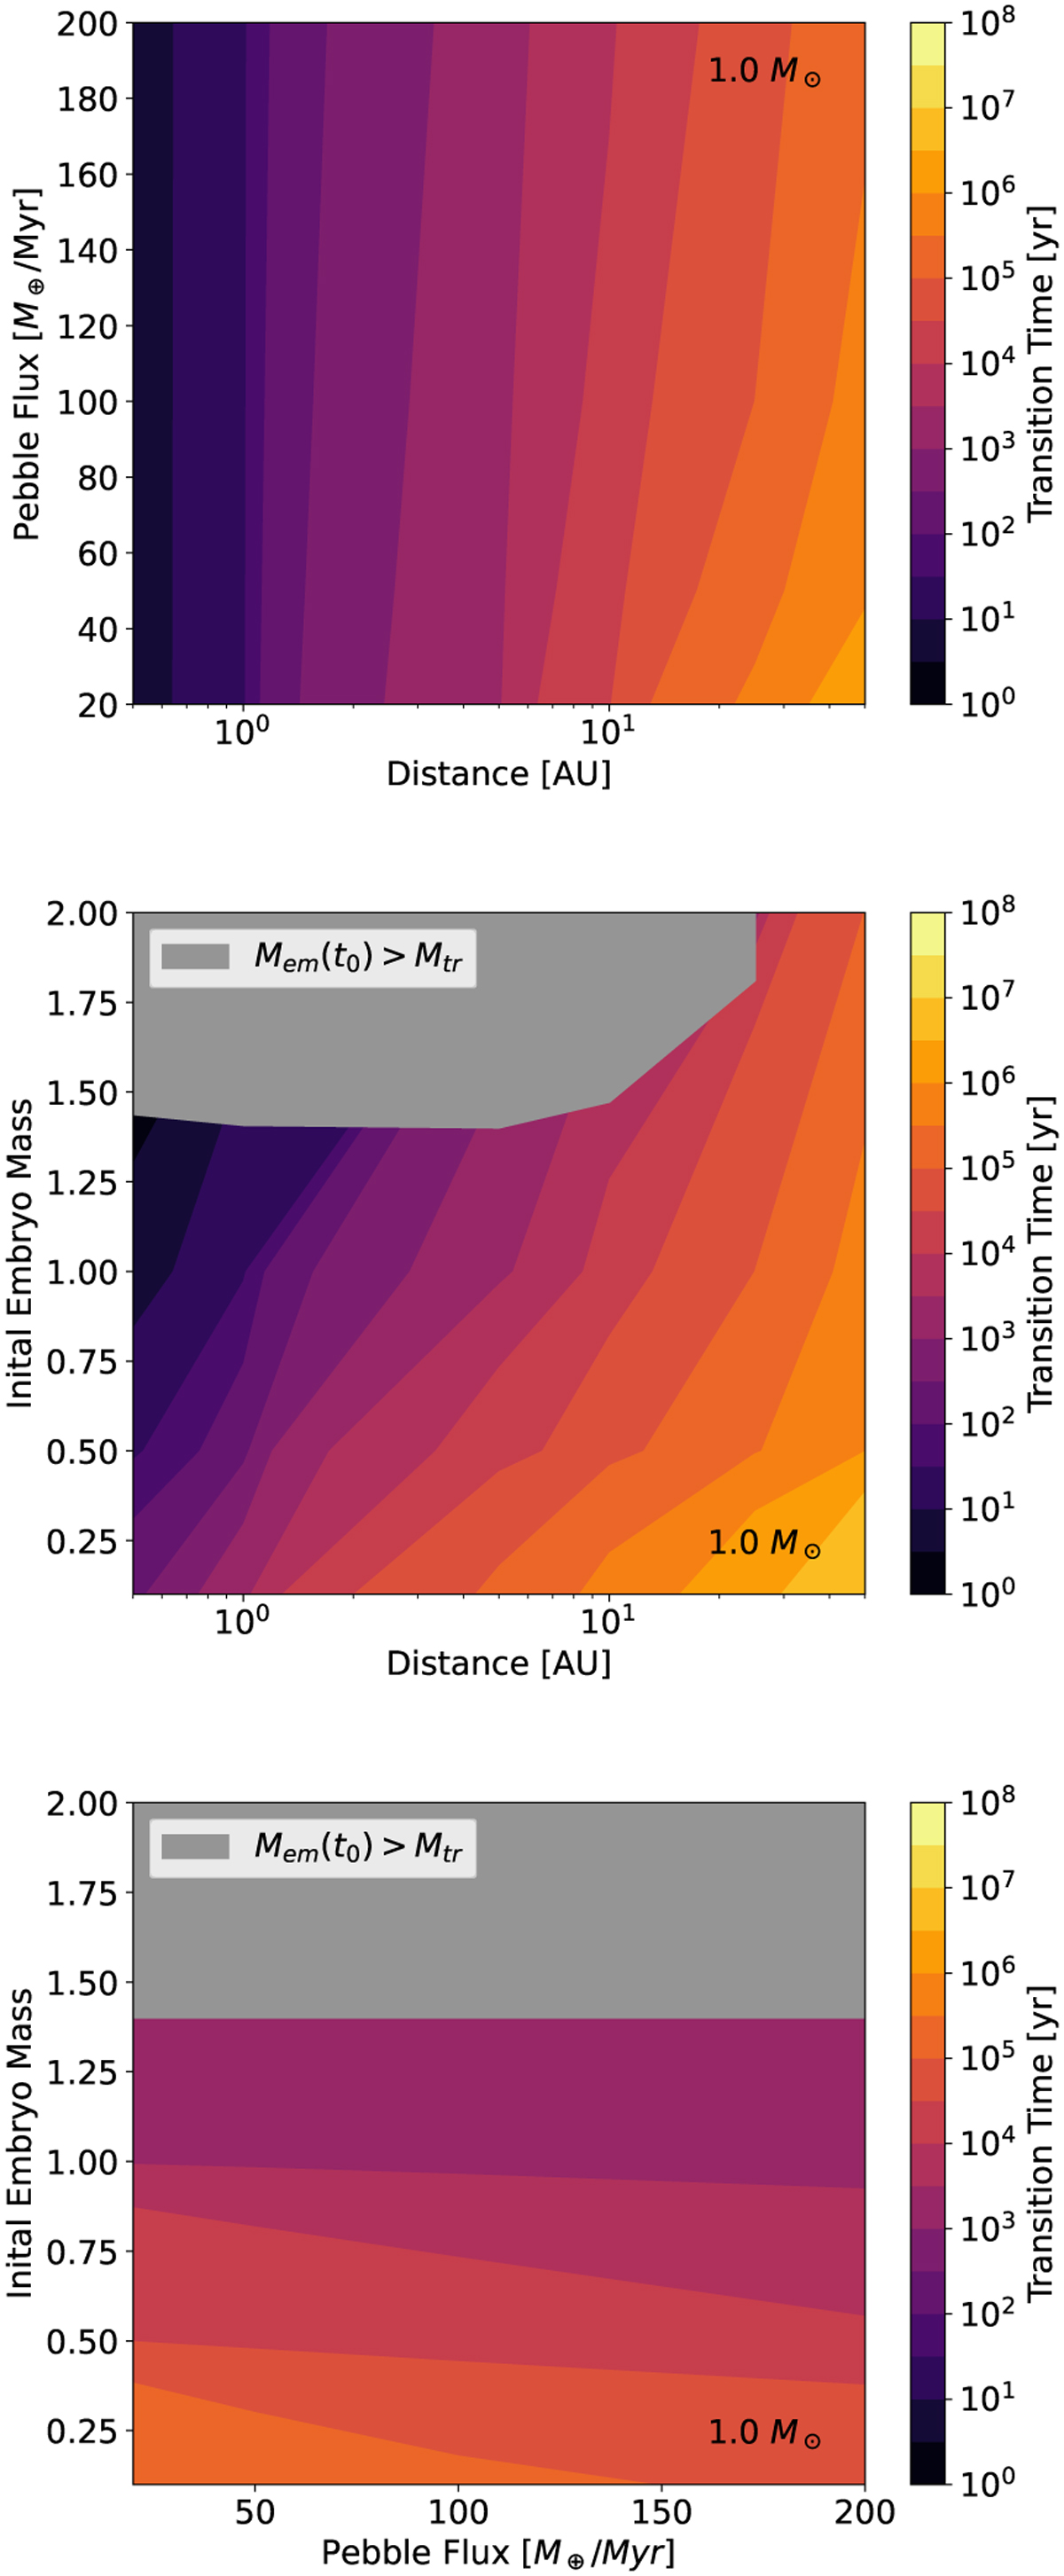
Transition timing (colour) for the grid simulations around a 1 M⊙ mass star as a function of two grid dimensions, where the last variable not plotted is given by the bold value in Table 1. The grey area refers to simulations where the initial embryo is already larger than the transition mass.
Current usage metrics show cumulative count of Article Views (full-text article views including HTML views, PDF and ePub downloads, according to the available data) and Abstracts Views on Vision4Press platform.
Data correspond to usage on the plateform after 2015. The current usage metrics is available 48-96 hours after online publication and is updated daily on week days.
Initial download of the metrics may take a while.