Fig. 4.
Download original image
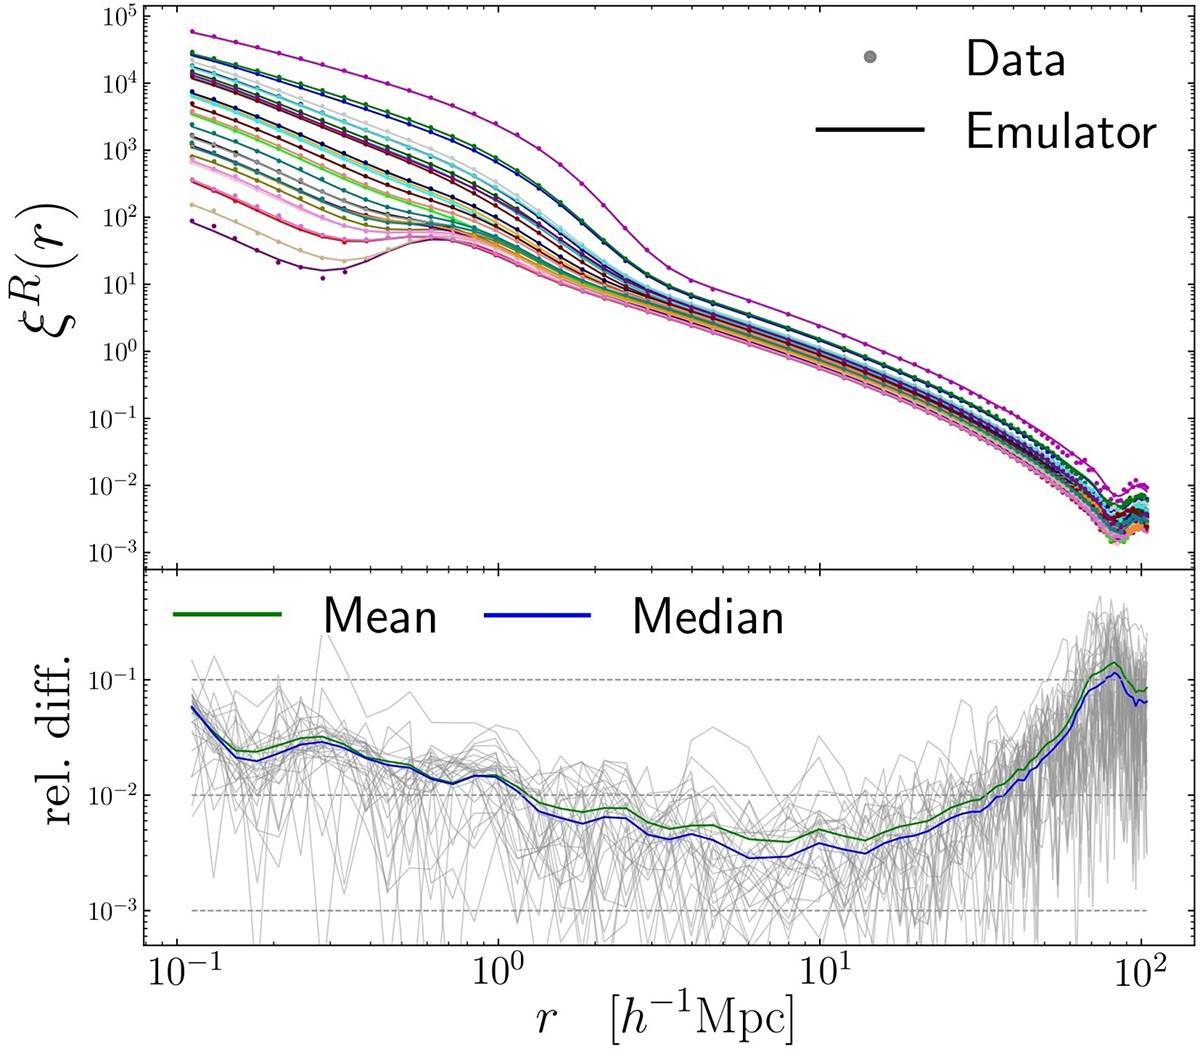
Upper panel: Example set of ξR sampled from 29 cosmologies in the test and validation datasets, comparing data measurements with emulator predictions. We scale ξR with r to emphasize the accuracy on large scales. Lower panel: Relative error of the prediction samples from the upper panel (gray lines) and the mean and median relative error from all samples in the test data.
Current usage metrics show cumulative count of Article Views (full-text article views including HTML views, PDF and ePub downloads, according to the available data) and Abstracts Views on Vision4Press platform.
Data correspond to usage on the plateform after 2015. The current usage metrics is available 48-96 hours after online publication and is updated daily on week days.
Initial download of the metrics may take a while.