Fig. 6.
Download original image
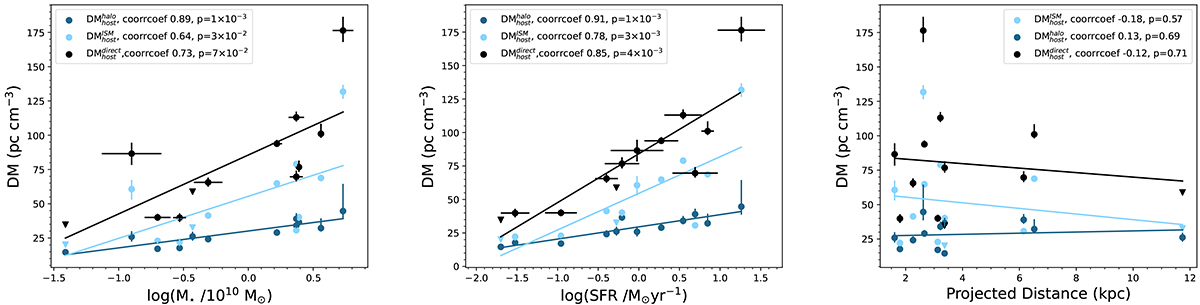
Rest-frame DM as a function of the stellar mass of the host (left), SFR of the host (middle), and projected offset from the center of the host (right). The black points correspond to DM![]() , while the light blue and the dark blue points correspond to DM
, while the light blue and the dark blue points correspond to DM![]() and DM
and DM![]() , respectively. The black line shows a linear fit for DM
, respectively. The black line shows a linear fit for DM![]() (=DM
(=DM![]() + DM
+ DM![]() ), while the light blue and dark blue lines are the linear fits of DM
), while the light blue and dark blue lines are the linear fits of DM![]() and DM
and DM![]() , respectively. The parameters of these fits are presented in Table B.1, and the Pearson coefficients and p-values are given in the figure legends.
, respectively. The parameters of these fits are presented in Table B.1, and the Pearson coefficients and p-values are given in the figure legends.
Current usage metrics show cumulative count of Article Views (full-text article views including HTML views, PDF and ePub downloads, according to the available data) and Abstracts Views on Vision4Press platform.
Data correspond to usage on the plateform after 2015. The current usage metrics is available 48-96 hours after online publication and is updated daily on week days.
Initial download of the metrics may take a while.