Fig. 4.
Download original image
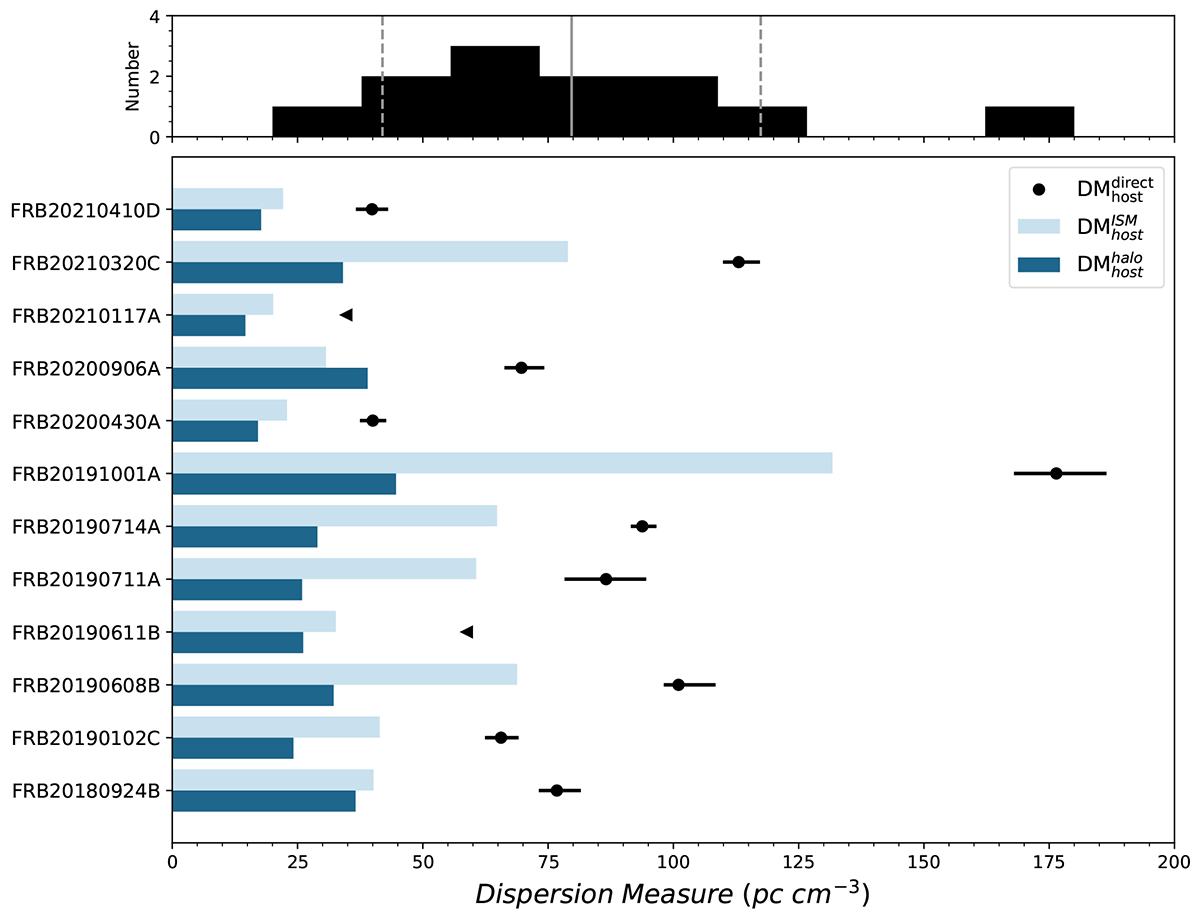
Estimates of DMhost for the 12 FRB hosts. The main panel shows each contribution of our empirical direct estimate (DM![]() in black points, DM
in black points, DM![]() in dark blue and DM
in dark blue and DM![]() in light blue). The upper panel is the histogram for DM
in light blue). The upper panel is the histogram for DM![]() . The mean and the standard deviation (±1σ) of the distribution are represented by the vertical solid and dashed lines, respectively.
. The mean and the standard deviation (±1σ) of the distribution are represented by the vertical solid and dashed lines, respectively.
Current usage metrics show cumulative count of Article Views (full-text article views including HTML views, PDF and ePub downloads, according to the available data) and Abstracts Views on Vision4Press platform.
Data correspond to usage on the plateform after 2015. The current usage metrics is available 48-96 hours after online publication and is updated daily on week days.
Initial download of the metrics may take a while.