Open Access
Fig. 3.
Download original image
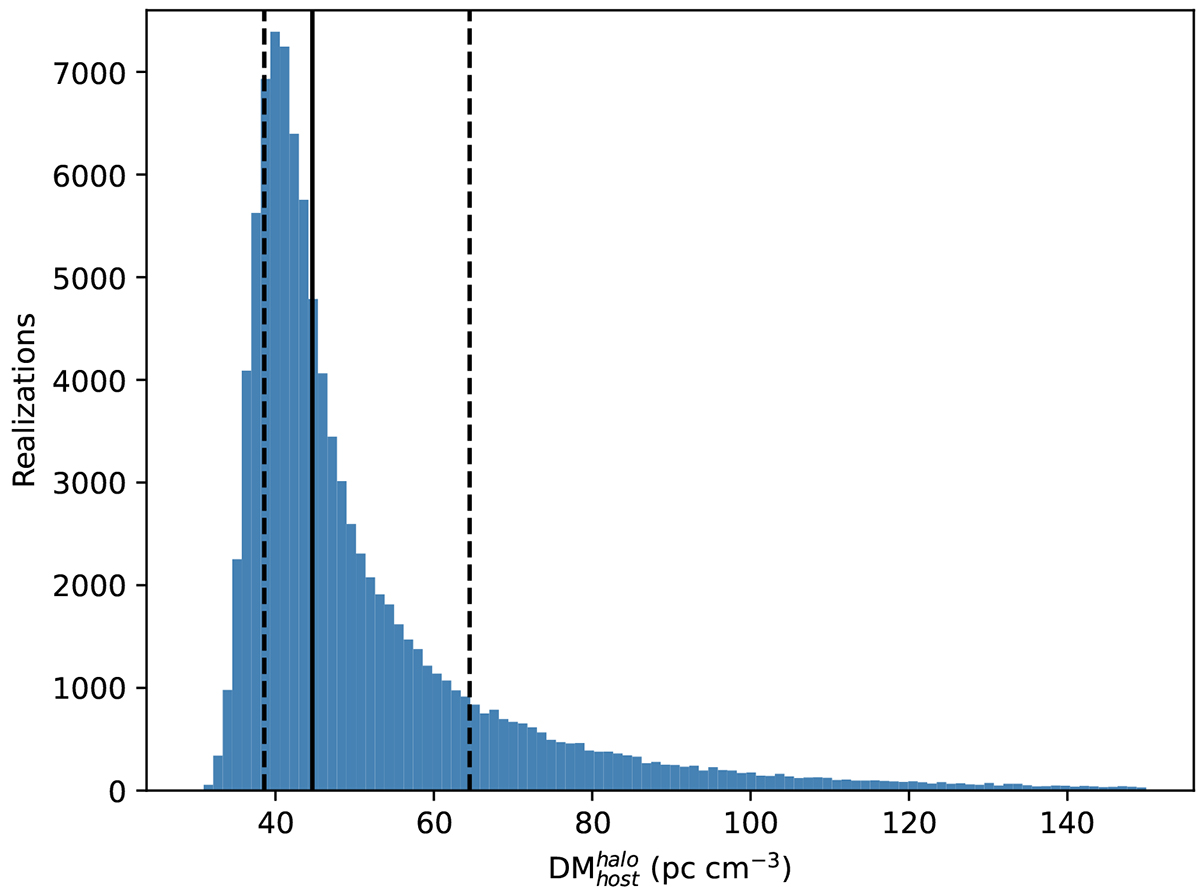
Distribution of DM![]() for FRB20191001A. The vertical solid black line represents the median value and the dashed black lines the corresponding 16th and 84th percentiles.
for FRB20191001A. The vertical solid black line represents the median value and the dashed black lines the corresponding 16th and 84th percentiles.
Current usage metrics show cumulative count of Article Views (full-text article views including HTML views, PDF and ePub downloads, according to the available data) and Abstracts Views on Vision4Press platform.
Data correspond to usage on the plateform after 2015. The current usage metrics is available 48-96 hours after online publication and is updated daily on week days.
Initial download of the metrics may take a while.