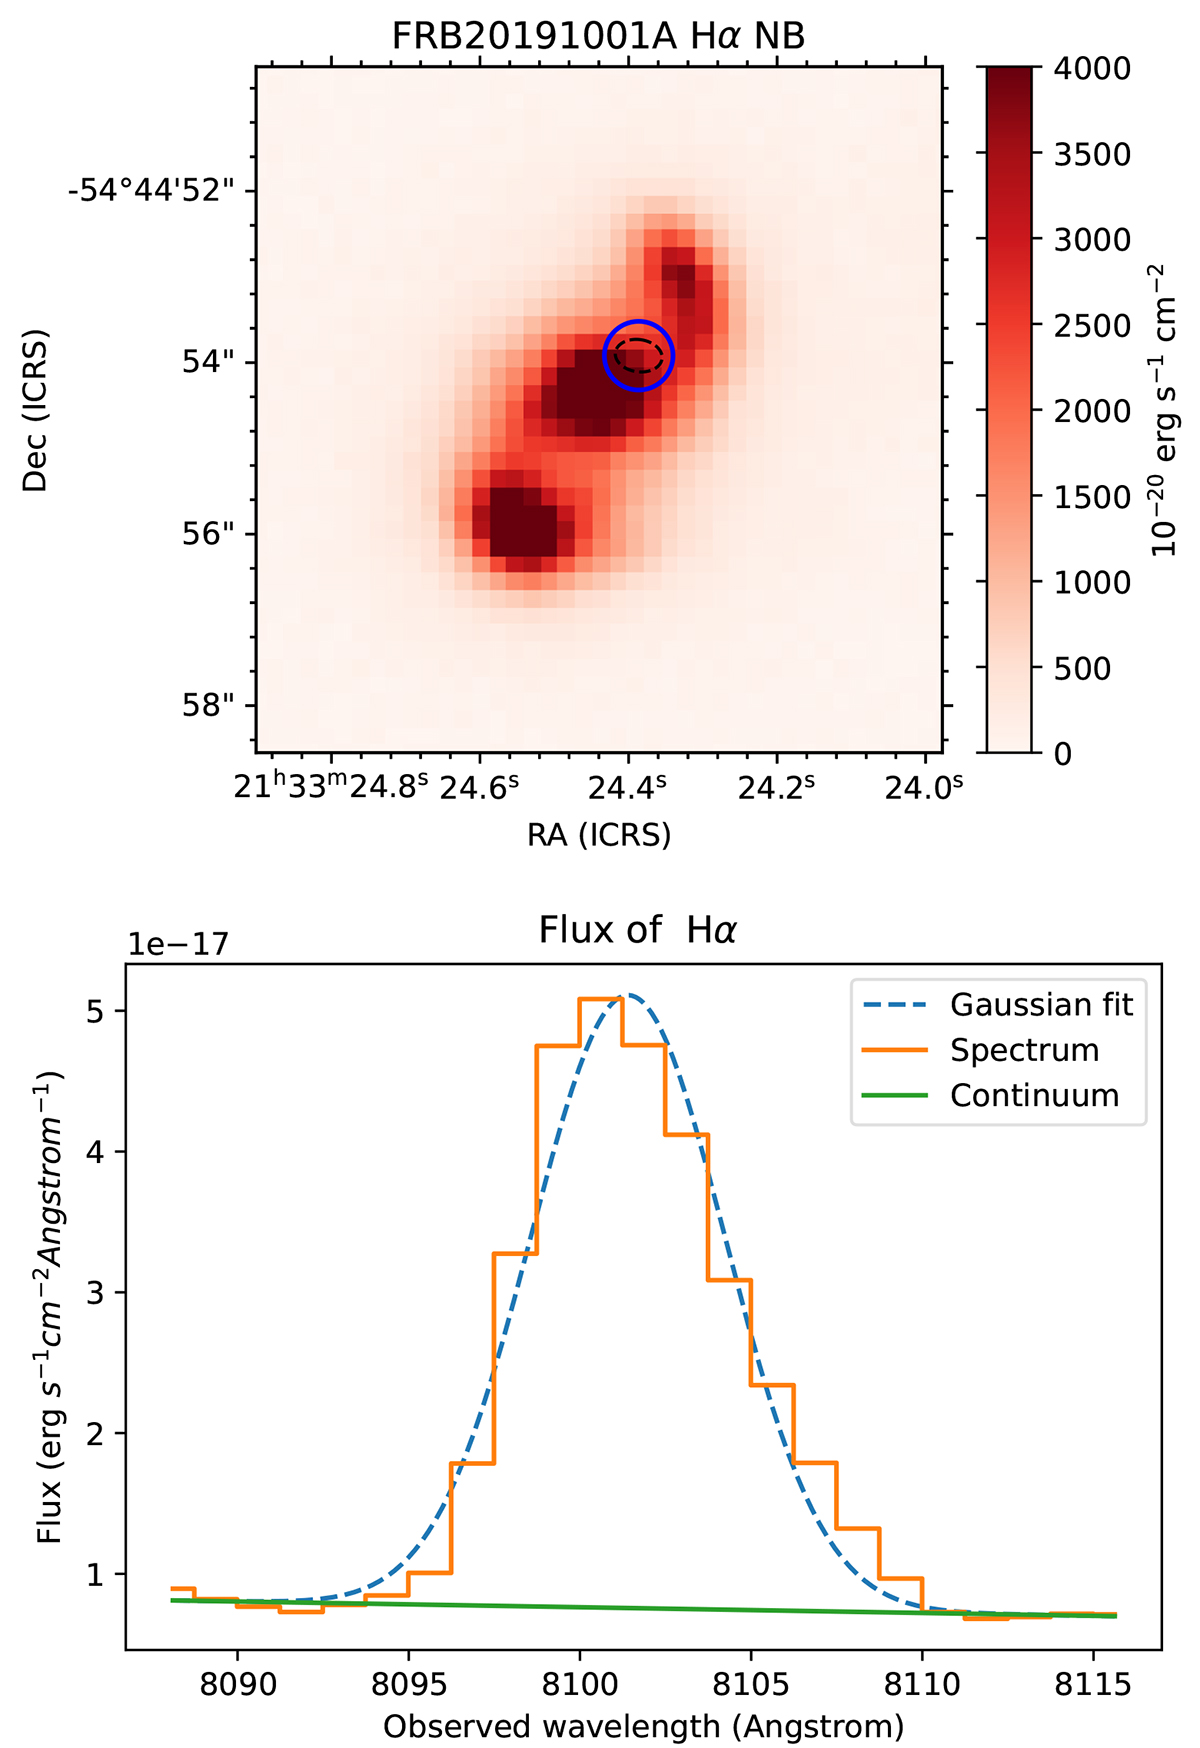
Fig. 1.
Download original image
Hα emission at the FRB location. Upper: FRB20191001A host emission integrated at the narrow band encompassing Hα using the same wavelength range as shown in the bottom panel. The blue circle is centered at the FRB localization and has a radius of 0.4″, and the dashed black ellipse represents the actual FRB position uncertainty. Lower: Integrated spectrum of the Hα emission within the blue circle (orange). We fit this emission with a Gaussian (dashed blue) plus a continuum (green).
Current usage metrics show cumulative count of Article Views (full-text article views including HTML views, PDF and ePub downloads, according to the available data) and Abstracts Views on Vision4Press platform.
Data correspond to usage on the plateform after 2015. The current usage metrics is available 48-96 hours after online publication and is updated daily on week days.
Initial download of the metrics may take a while.