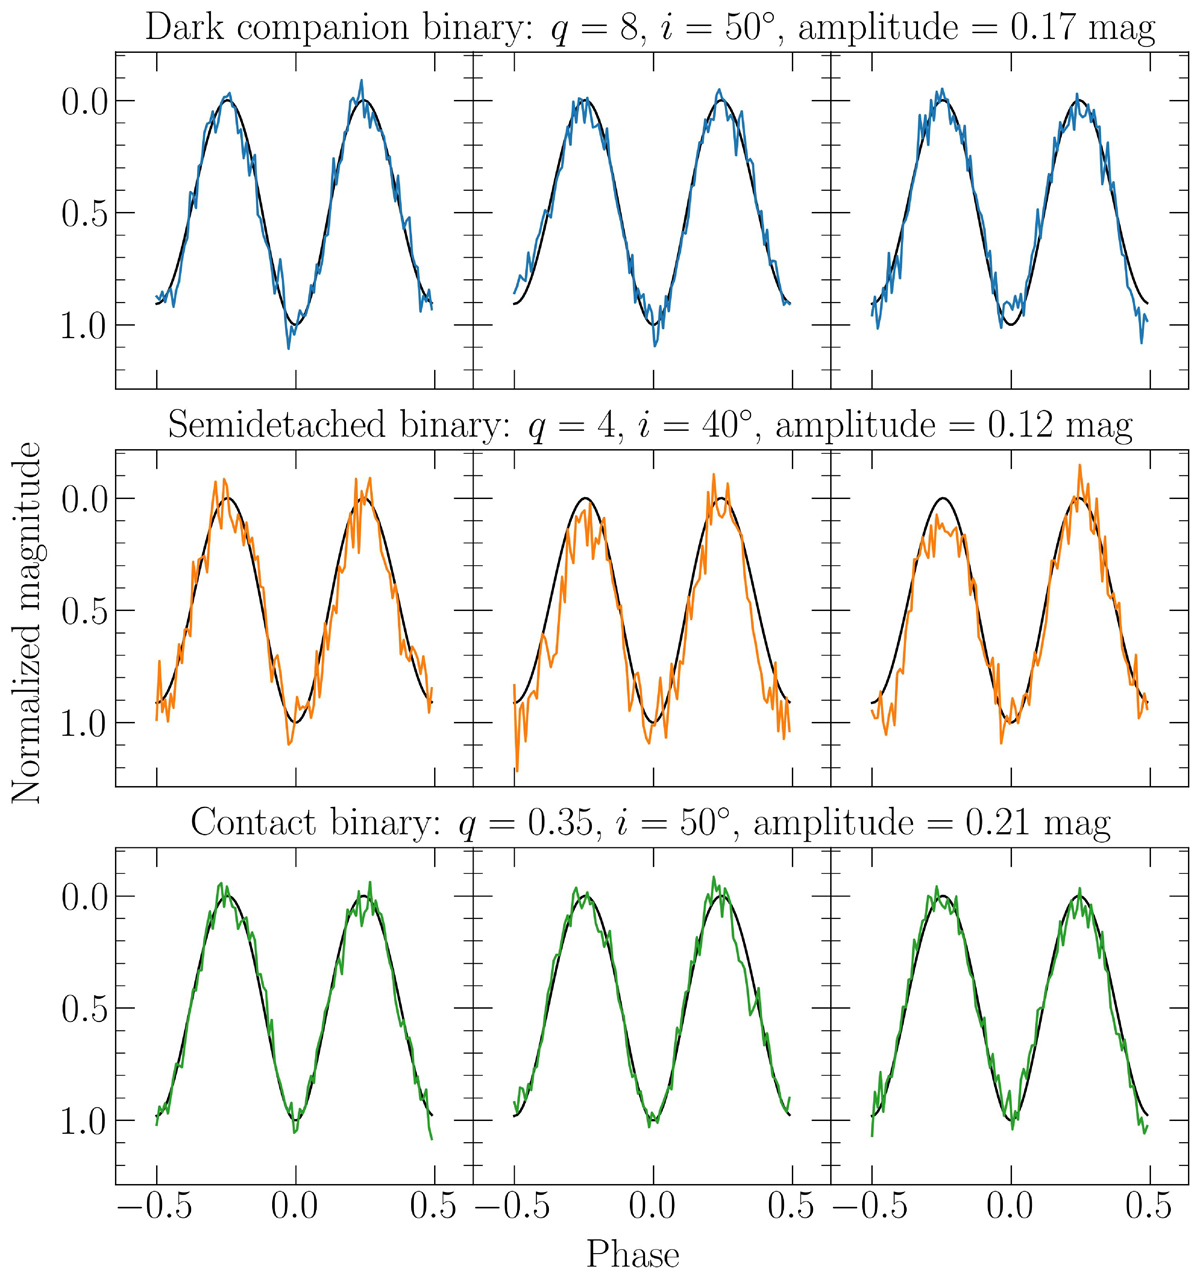
Fig. 1.
Download original image
Examples of normalized synthetic light curves of dark companion (top panel), semidetached (middle panel), and contact binary systems (bottom panel). Each panel contains three subplots showing different light curve realizations of the system characterized by the mass ratio q and inclination i specified at the top of the panel. The solid black lines represent the noise-free light curves of the systems, while the colored lines show the light curves perturbed with noise. All noisy light curves were injected with uncorrelated Gaussian noise with a standard deviation σWN = 10−2 mag and correlated Gaussian noise modeled using the ExpSineSquared kernel with a standard deviation σCN = 0.05 of the unperturbed light curve amplitude (given at the top of each panel) and correlation length scale lCN = 0.25 of the orbital period.
Current usage metrics show cumulative count of Article Views (full-text article views including HTML views, PDF and ePub downloads, according to the available data) and Abstracts Views on Vision4Press platform.
Data correspond to usage on the plateform after 2015. The current usage metrics is available 48-96 hours after online publication and is updated daily on week days.
Initial download of the metrics may take a while.