Fig. 9.
Download original image
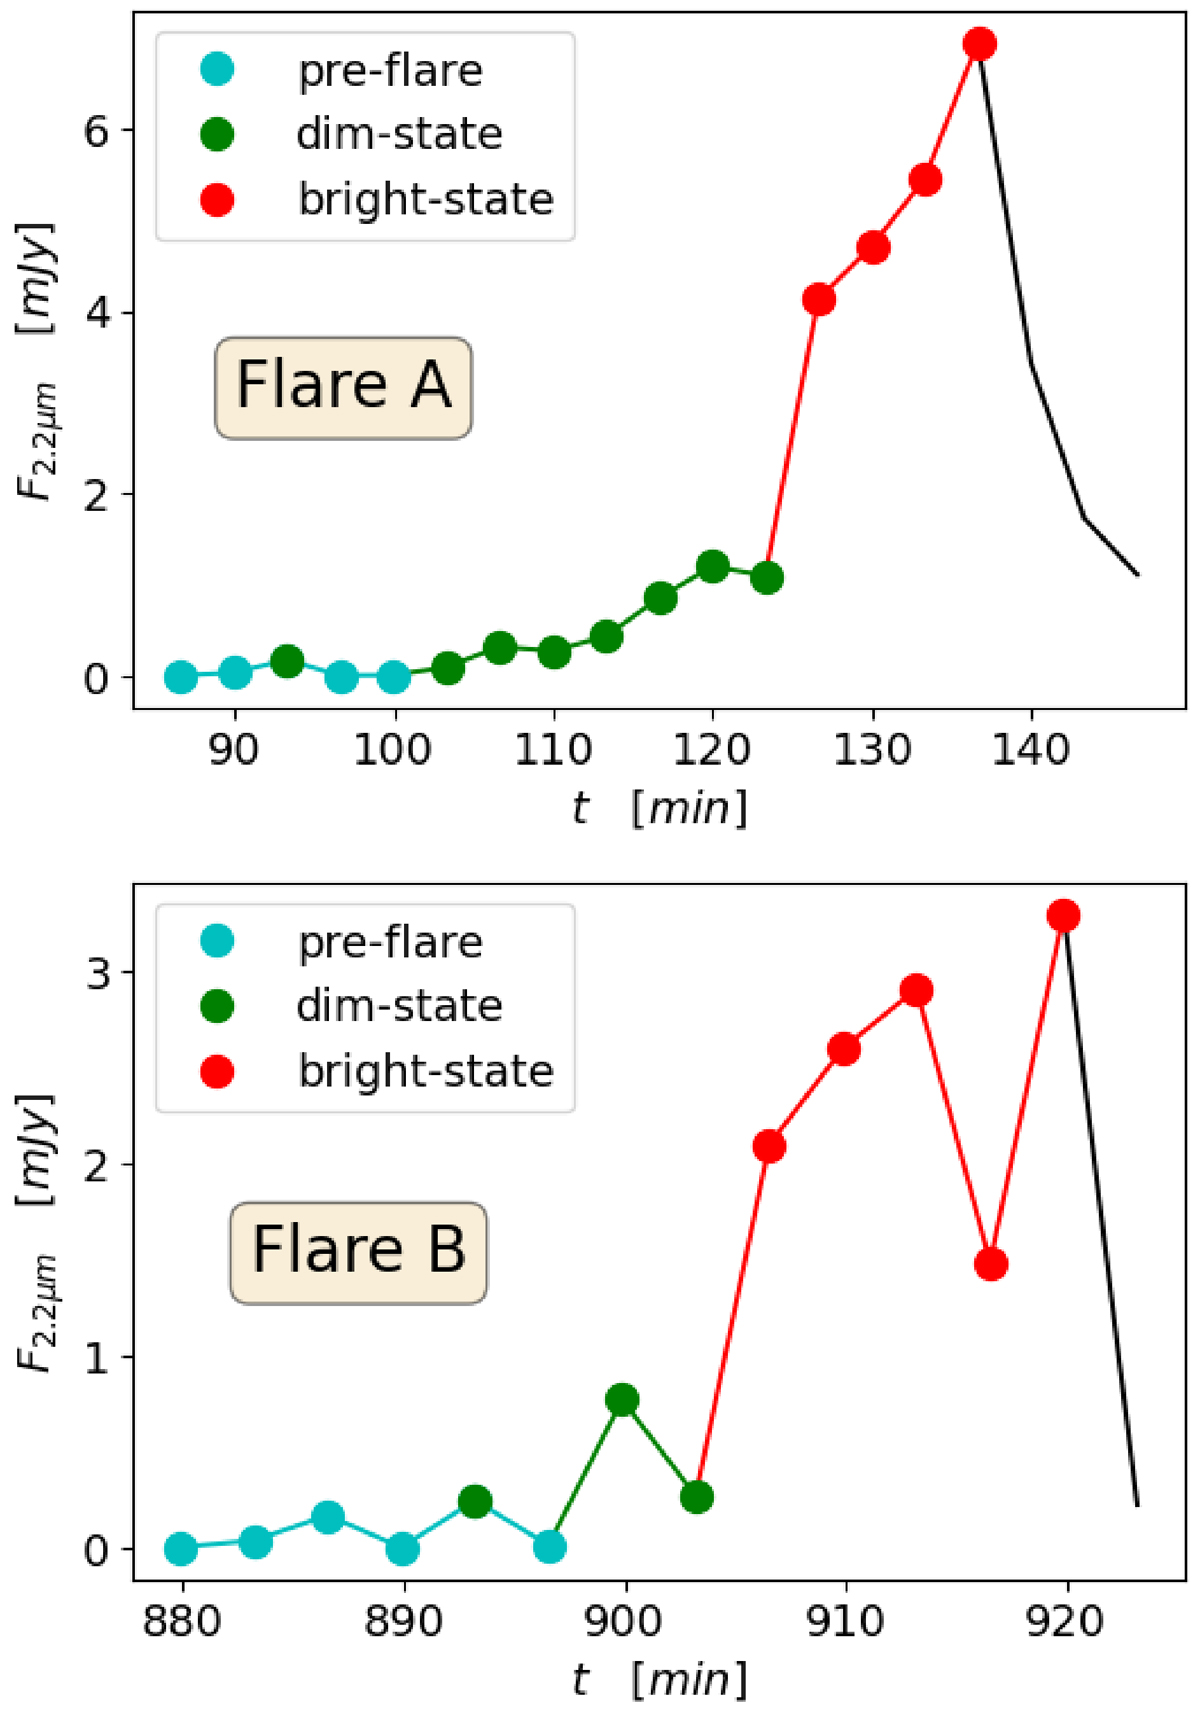
Part of the light curve at 2.2 μm. Top: Flare A during the period t ∈ [86, 150] min (the first bright flare with approximately 7 mJy radiation flux). Bottom: Flare B during the period t ∈ [879, 926] min (a bright flare with two peaks). The duration of the flares is about 40–60 minutes. We divided the light curve into three states: pre-flare, dim state, and bright state. This separation is based on the flux and spectral index
Current usage metrics show cumulative count of Article Views (full-text article views including HTML views, PDF and ePub downloads, according to the available data) and Abstracts Views on Vision4Press platform.
Data correspond to usage on the plateform after 2015. The current usage metrics is available 48-96 hours after online publication and is updated daily on week days.
Initial download of the metrics may take a while.