Open Access
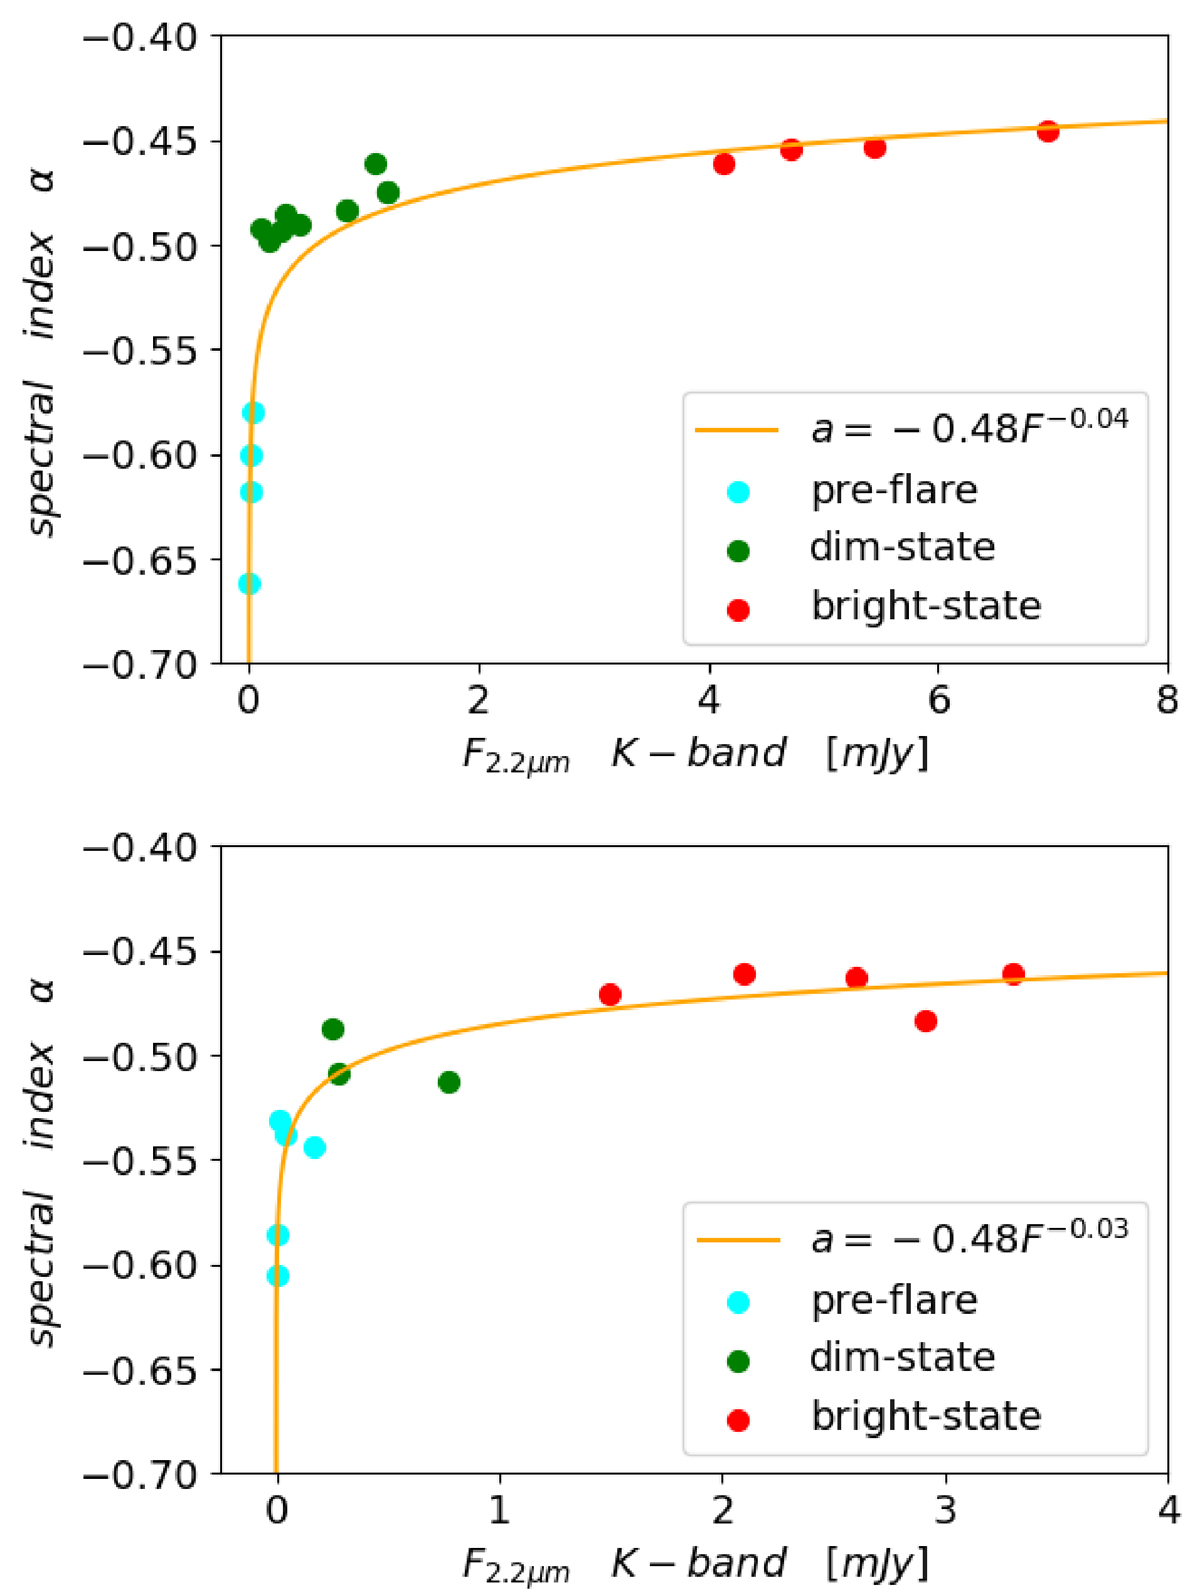
Fig. 11.
Download original image
Spectral index vs. flux for Flare A (top) and Flare B (bottom). The dots correspond to the snapshots that are marked in Fig. 9: the pre-flare (cyan), dim (green), and bright states (red) of each flare. The orange lines are a fitting power-law curve, which can be compared with observations.
Current usage metrics show cumulative count of Article Views (full-text article views including HTML views, PDF and ePub downloads, according to the available data) and Abstracts Views on Vision4Press platform.
Data correspond to usage on the plateform after 2015. The current usage metrics is available 48-96 hours after online publication and is updated daily on week days.
Initial download of the metrics may take a while.