Fig. 7.
Download original image
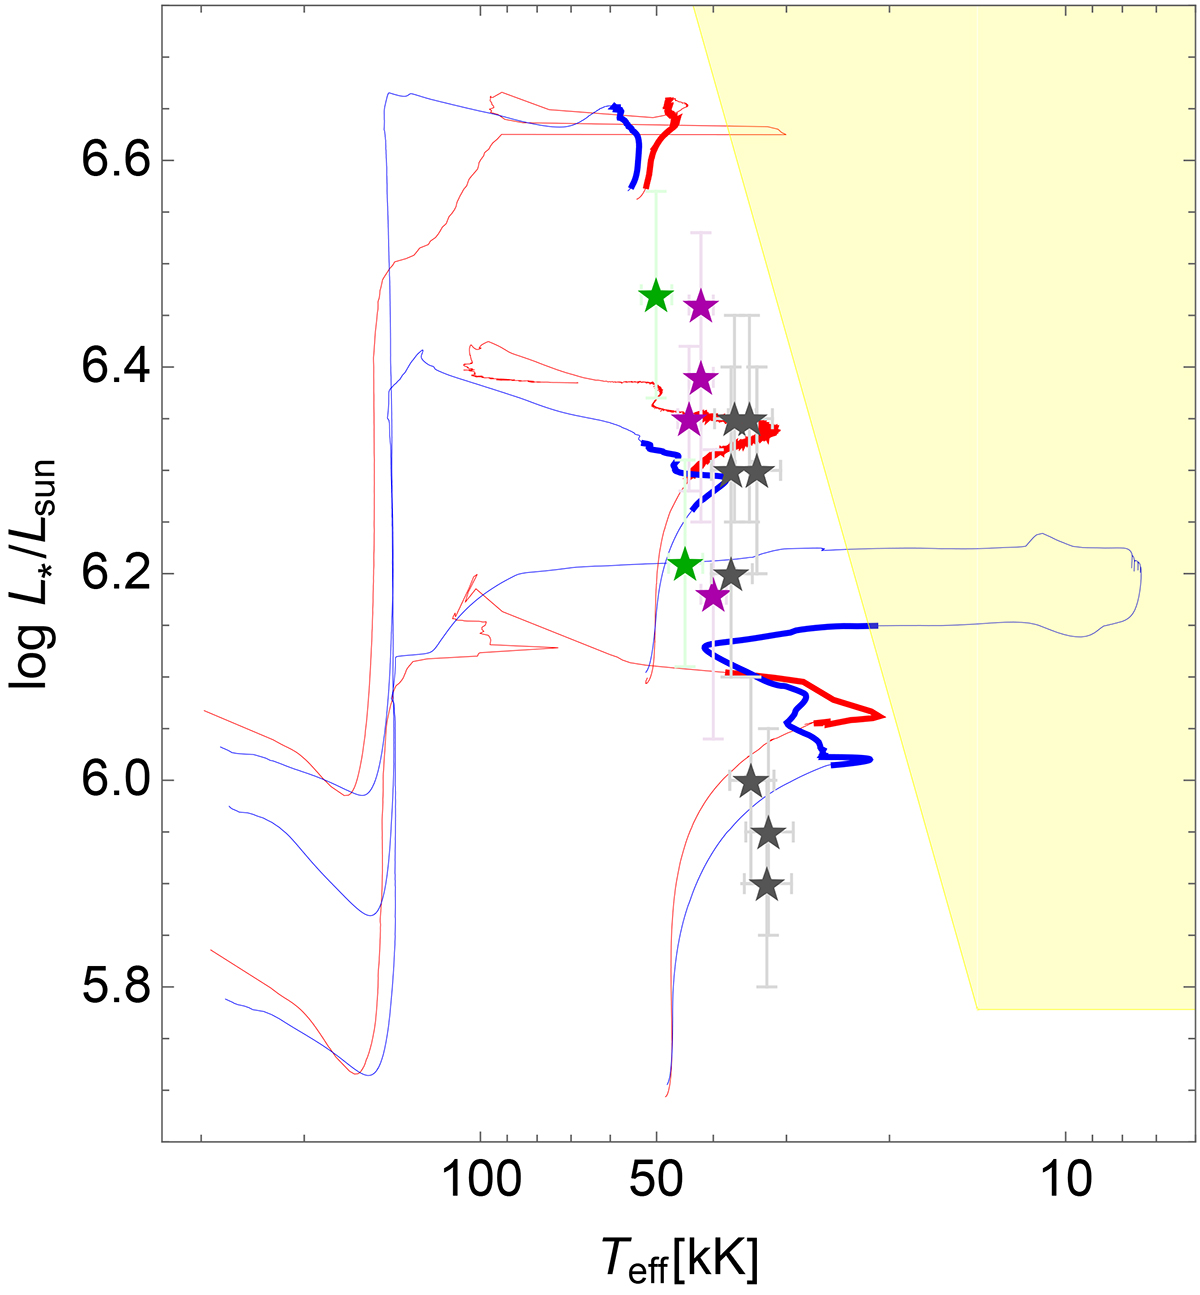
Evolutionary GENEC and MESA tracks for 60 and 200 M⊙ from Fig. 1 and additional 100 M⊙ models, where the thick solid lines represent the segments where the wind is optically thick (Γe ≥ 0.5) and Xsurf ≥ 0.3. The gray stars correspond to the sample of WNh stars from Martins et al. (2008), the purple stars to the sample of Crowther et al. (2010) and the green stars to the sample of Hamann et al. (2019), tabulated in Table 4. Yellow shadowed area correspond to the HRD region where the HD limit is exceeded.
Table 4.
WNh stars included in Fig. 7.
Notes. (1) Martins et al. (2008); (2) Crowther et al. (2010); (3) Hamann et al. (2019).
Current usage metrics show cumulative count of Article Views (full-text article views including HTML views, PDF and ePub downloads, according to the available data) and Abstracts Views on Vision4Press platform.
Data correspond to usage on the plateform after 2015. The current usage metrics is available 48-96 hours after online publication and is updated daily on week days.
Initial download of the metrics may take a while.