Open Access
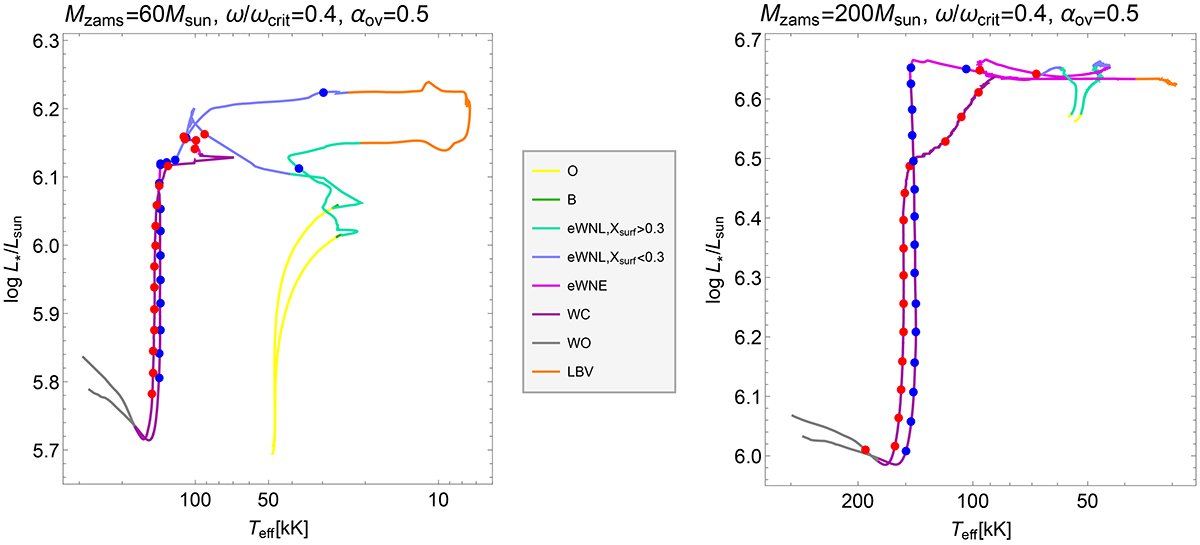
Fig. 6.
Download original image
Distribution across the HRD of the evolutionary spectral types introduced in Sect. 4.3. The red and blue dots represents time intervals of 20 000 years, starting from the end of the H-core burning, for our GENEC and MESA models, respectively.
Current usage metrics show cumulative count of Article Views (full-text article views including HTML views, PDF and ePub downloads, according to the available data) and Abstracts Views on Vision4Press platform.
Data correspond to usage on the plateform after 2015. The current usage metrics is available 48-96 hours after online publication and is updated daily on week days.
Initial download of the metrics may take a while.