Open Access
Fig. 4.
Download original image
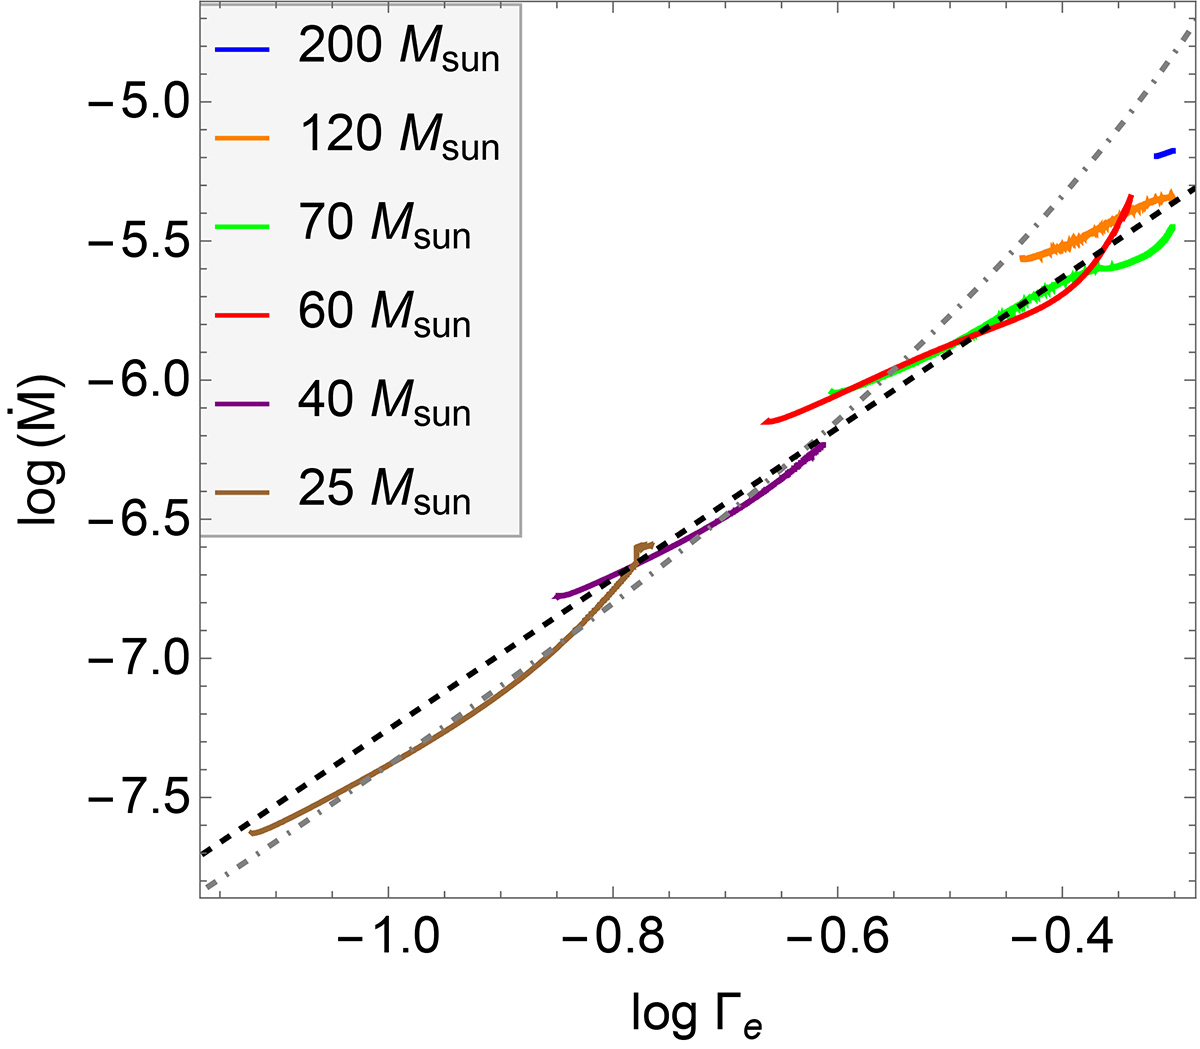
Ṁ − Γe correlations taken from the GENEC self-consistent evolution models from Gormaz-Matamala et al. (2023) and this work. The dashed line represents the best linear fit for these Msc, whereas the gray dot-dashed line represents the fit of Eq. (5) adopted for Z = 0.014.
Current usage metrics show cumulative count of Article Views (full-text article views including HTML views, PDF and ePub downloads, according to the available data) and Abstracts Views on Vision4Press platform.
Data correspond to usage on the plateform after 2015. The current usage metrics is available 48-96 hours after online publication and is updated daily on week days.
Initial download of the metrics may take a while.