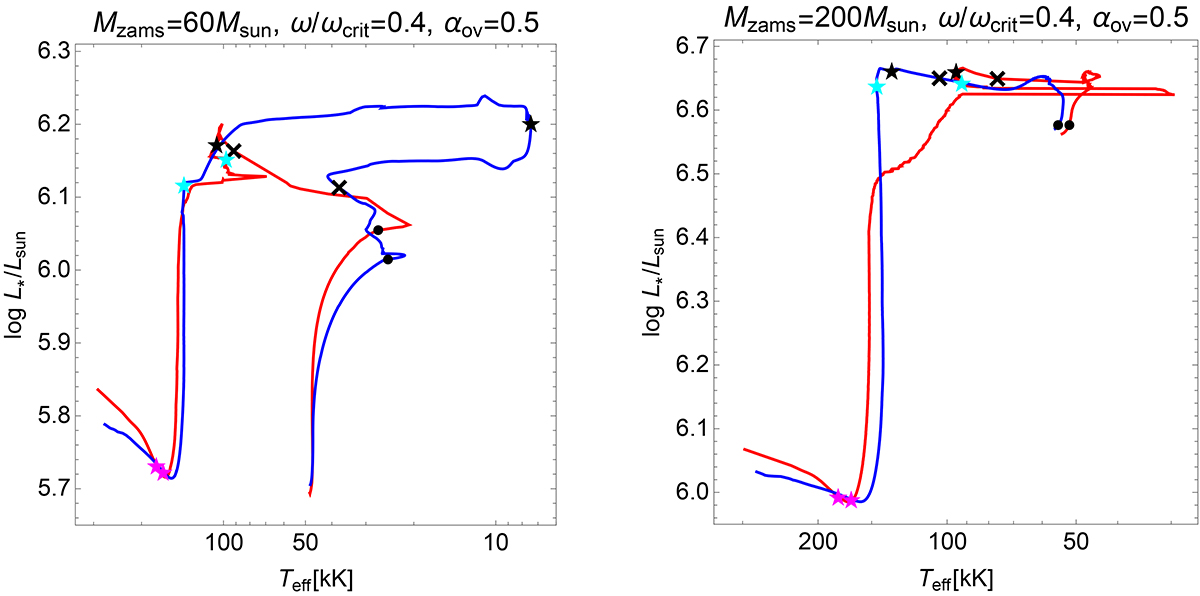
Fig. 1.

Download original image
HR diagram for GENEC (red) and MESA (blue) evolution models with 60 M⊙ (left panel) and 200 M⊙ (right panel). Black dots represent the point where Γe = 0.5 and thus the wind regime transits from thin to optically thick, black crosses represent the end of the H-core burning stage, black stars represent the beginning of the He-core burning stage, cyan stars represent the switch between H-rich to H-poor helium stars, and magenta stars represent the end of the He-core burning stage.
Current usage metrics show cumulative count of Article Views (full-text article views including HTML views, PDF and ePub downloads, according to the available data) and Abstracts Views on Vision4Press platform.
Data correspond to usage on the plateform after 2015. The current usage metrics is available 48-96 hours after online publication and is updated daily on week days.
Initial download of the metrics may take a while.


