Fig. 5
Download original image
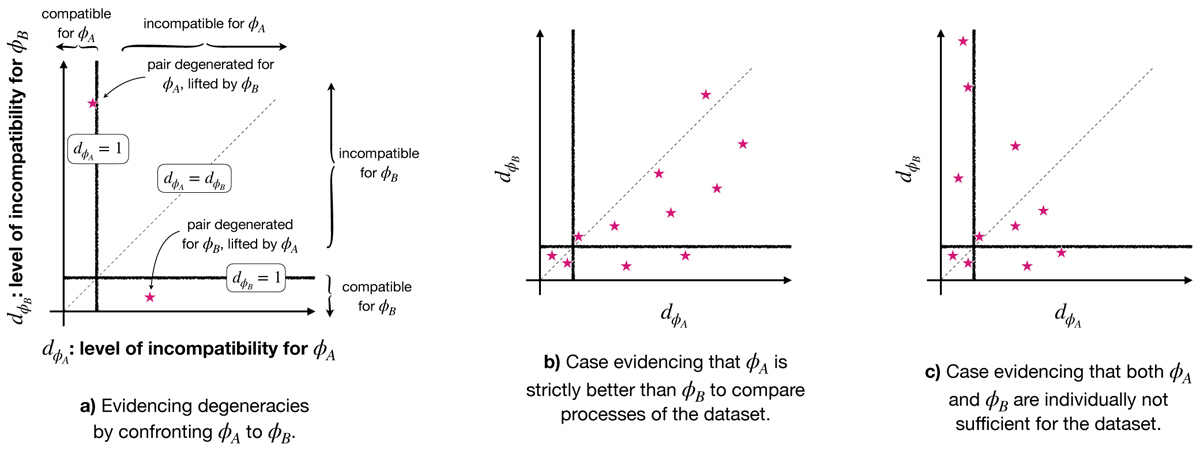
Illustration of the proposed test to confront two sets of summary statistics, ϕA versus ϕB, on their degeneracy level for a given dataset. Each star represents a pair of patches. Panel a: the presence of stars in the bottom right region, i.e., where dϕA ≫ 1 and dϕB ⪅ 1, reveals that some pairs of this dataset are identified by ϕA as incompatible but not by ϕB: such pairs thus evidence degeneracies of ϕB lifted by ϕA. Conversely, the presence of stars in the top left region evidences degeneracies of ϕA lifted by ϕB. Hence, if all the points land mainly in the sub-diagonal part (panel b), this evidences that ϕA is better suited than ϕB to compare the pairs of this dataset. If on the contrary the points are spread both in the upper left and bottom right regions of the plot (panel c), this shows that both ϕA and ϕB are individually not sufficient to describe the processes of this dataset.
Current usage metrics show cumulative count of Article Views (full-text article views including HTML views, PDF and ePub downloads, according to the available data) and Abstracts Views on Vision4Press platform.
Data correspond to usage on the plateform after 2015. The current usage metrics is available 48-96 hours after online publication and is updated daily on week days.
Initial download of the metrics may take a while.