Fig. 2
Download original image
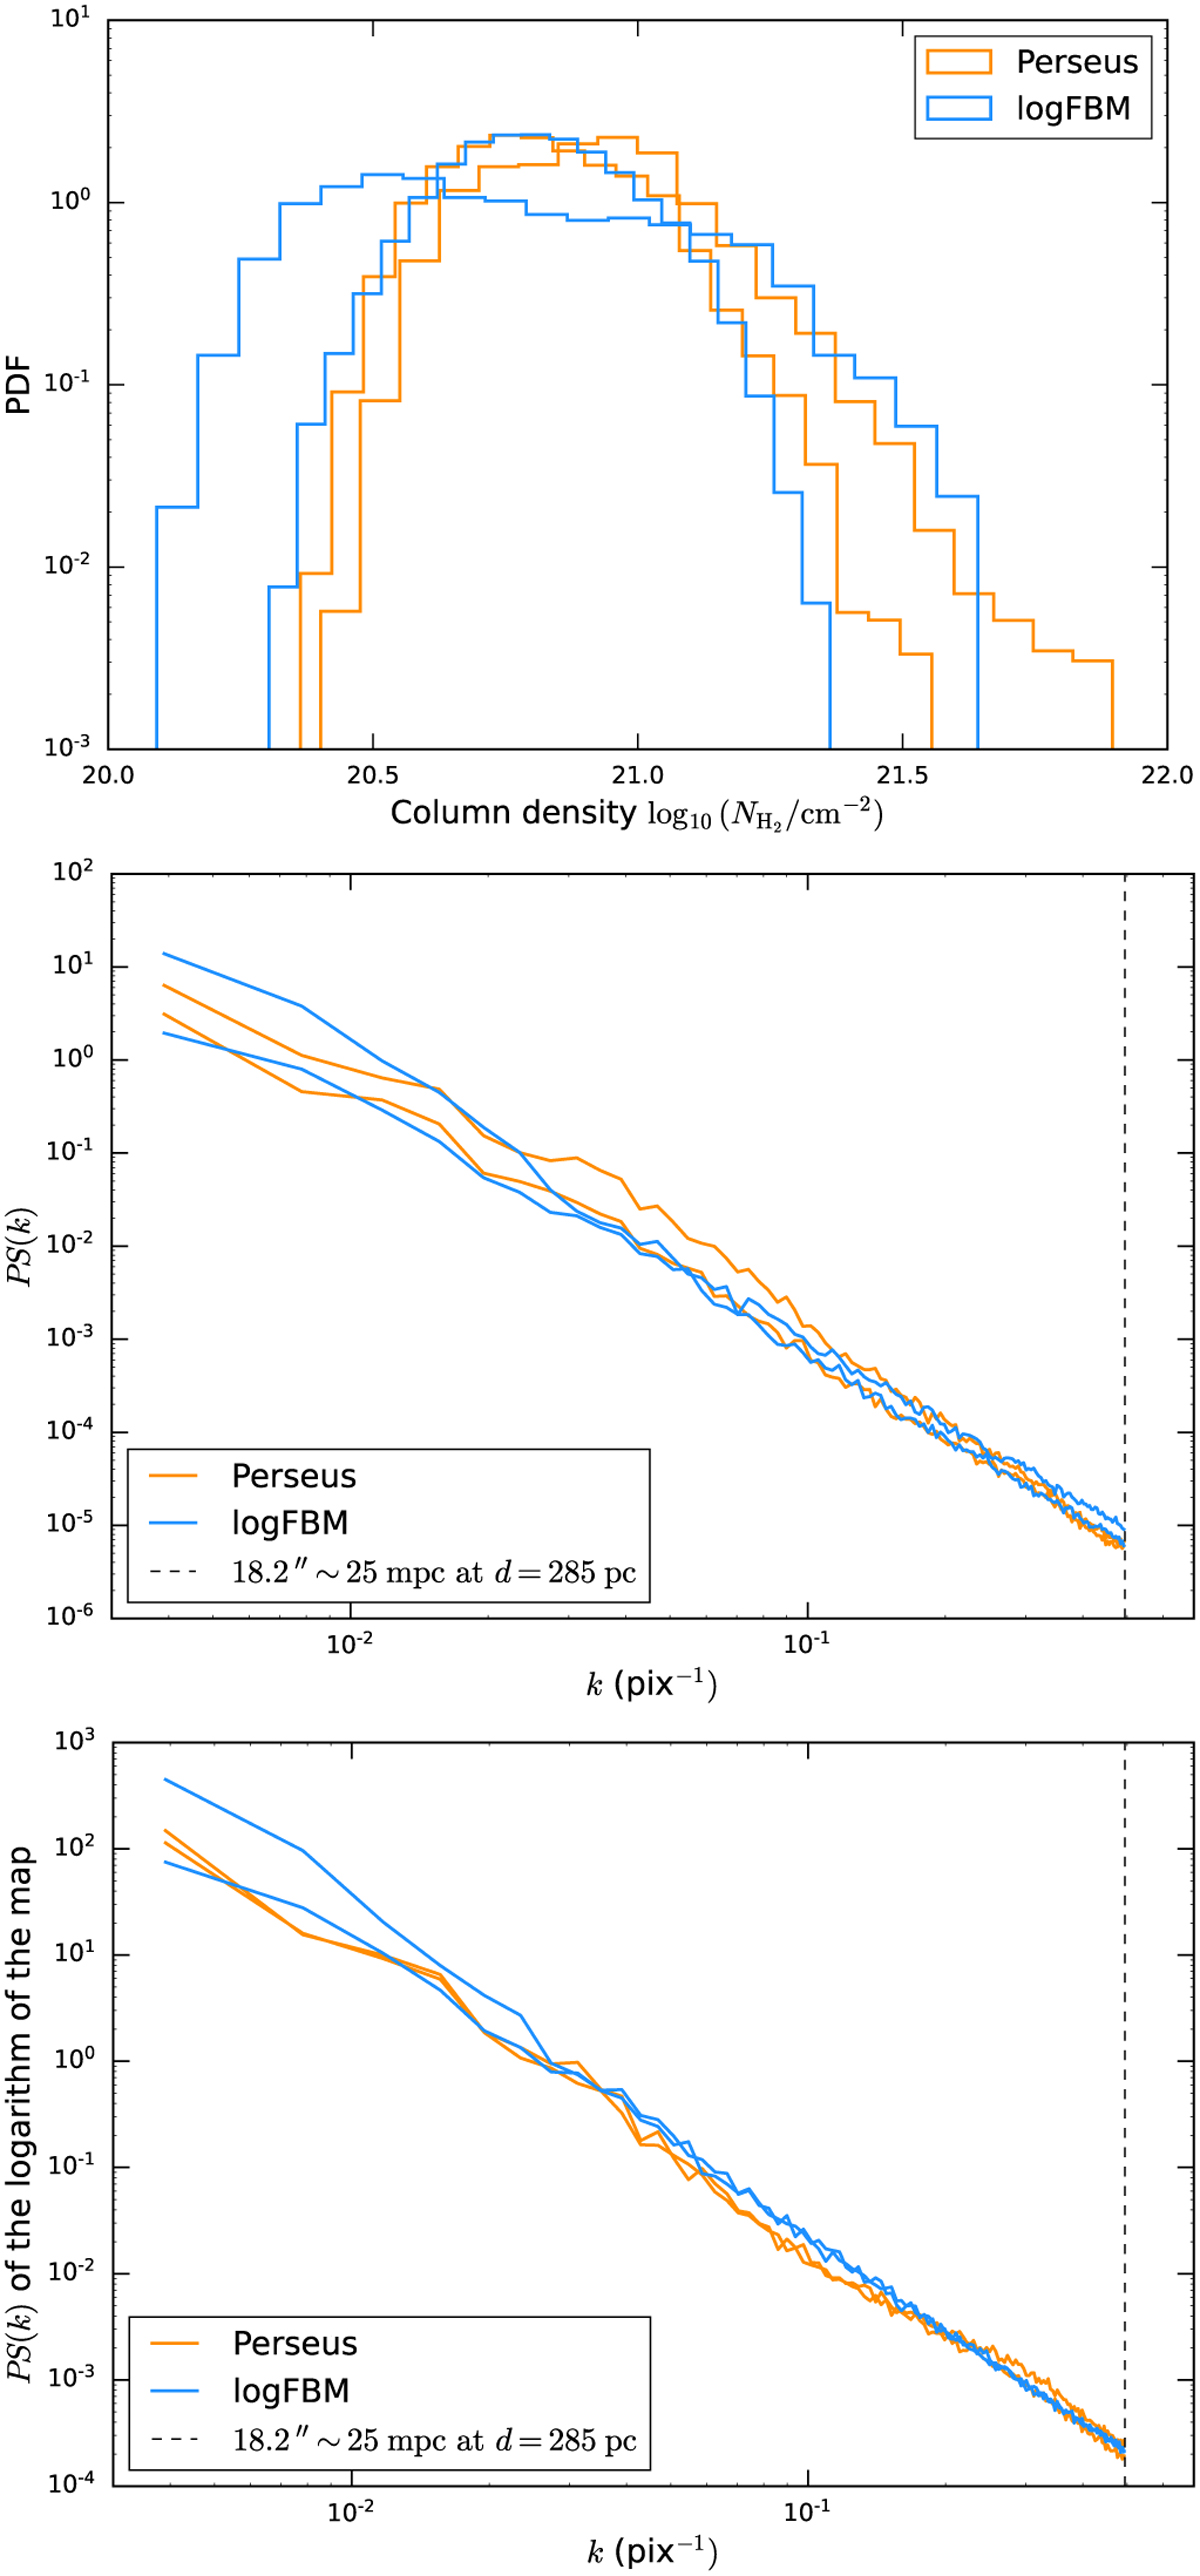
Statistical properties of the maps from Fig. 1: PDFs (top), power spectra (center), and power spectra of the logarithms of the maps (bottom). The dashed vertical line in the power spectra plots is located at the 18.2″ resolution of the column density map from the observational dataset. Power spectra are apodized as explained in Sect. 4. We see that the logFBM process is compatible with this observed portion of MC for all these statistics (some of theme being non-Gaussian), while having a manifestly different morphology, as revealed in Fig. 1. All these statistics are thus degenerate for such a comparison.
Current usage metrics show cumulative count of Article Views (full-text article views including HTML views, PDF and ePub downloads, according to the available data) and Abstracts Views on Vision4Press platform.
Data correspond to usage on the plateform after 2015. The current usage metrics is available 48-96 hours after online publication and is updated daily on week days.
Initial download of the metrics may take a while.