Fig. E.1
Download original image
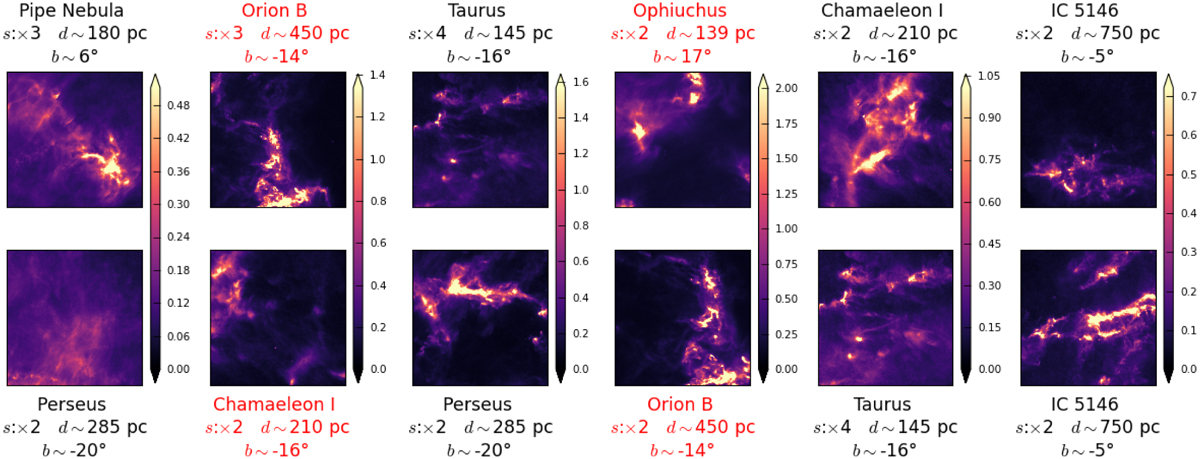
Examples of log-Gaussian degeneracies. Six pairs of 512 × 512 patches are chosen, whose locations on the scatter plot of Fig. 10b are given there by the red stars. The column density maps are shown in units of 1020cm−2. For each patch, we report: s the subsampling factor from the original 3″/pix map, d and b the approximated distance and Galactic latitude of the cloud. If a pair has patches (i, j) with incompatible pixel sizes according to the following criterion ![]() , we color its labels in red.
, we color its labels in red.
Current usage metrics show cumulative count of Article Views (full-text article views including HTML views, PDF and ePub downloads, according to the available data) and Abstracts Views on Vision4Press platform.
Data correspond to usage on the plateform after 2015. The current usage metrics is available 48-96 hours after online publication and is updated daily on week days.
Initial download of the metrics may take a while.