Fig. 13
Download original image
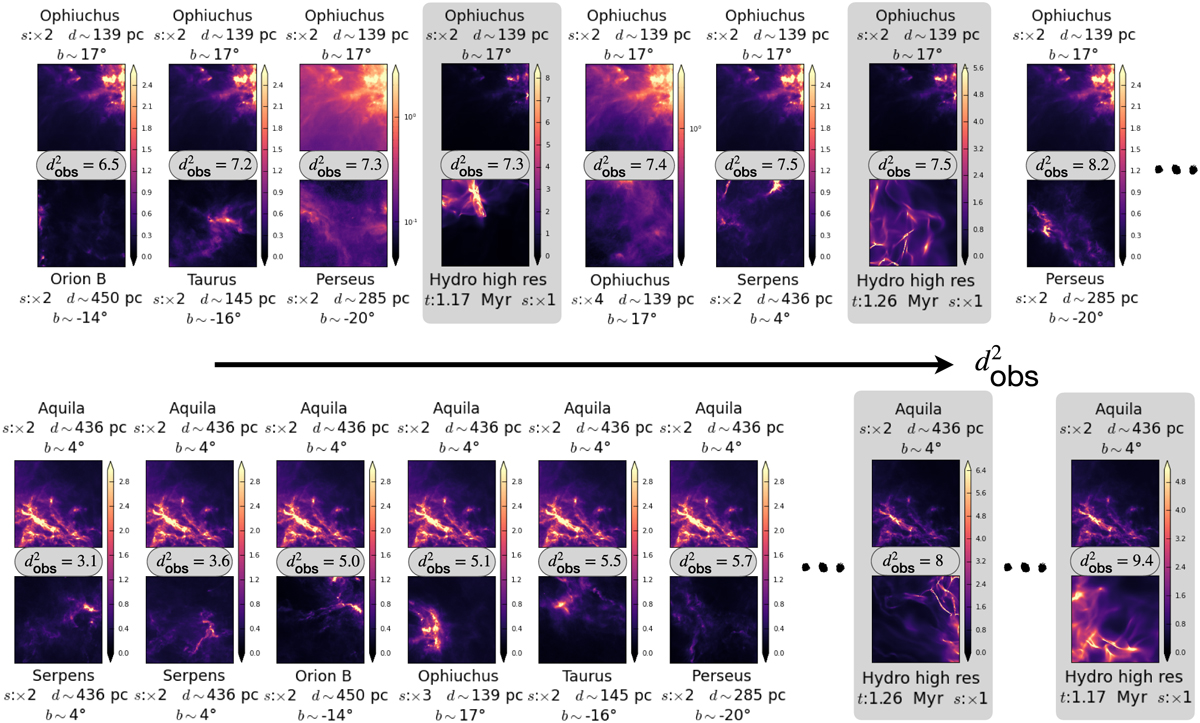
Comparison of closest (OBS, SIM) pairs (i, j) (gray boxes) to neighboring (OBS, OBS) pairs (i, i′). The top row focuses on the closest observation to simulations, which corresponds to a patch of Ophiuchus, while the bottom row focuses on the second closest patch, which is in Aquila. In the latter case, neighboring (but independent) observations of Aquila are significantly closer than the closest simulations. The maps are shown in units of 1020cm−2 but the colorbars can change from a pair to another.
Current usage metrics show cumulative count of Article Views (full-text article views including HTML views, PDF and ePub downloads, according to the available data) and Abstracts Views on Vision4Press platform.
Data correspond to usage on the plateform after 2015. The current usage metrics is available 48-96 hours after online publication and is updated daily on week days.
Initial download of the metrics may take a while.