Fig. 12
Download original image
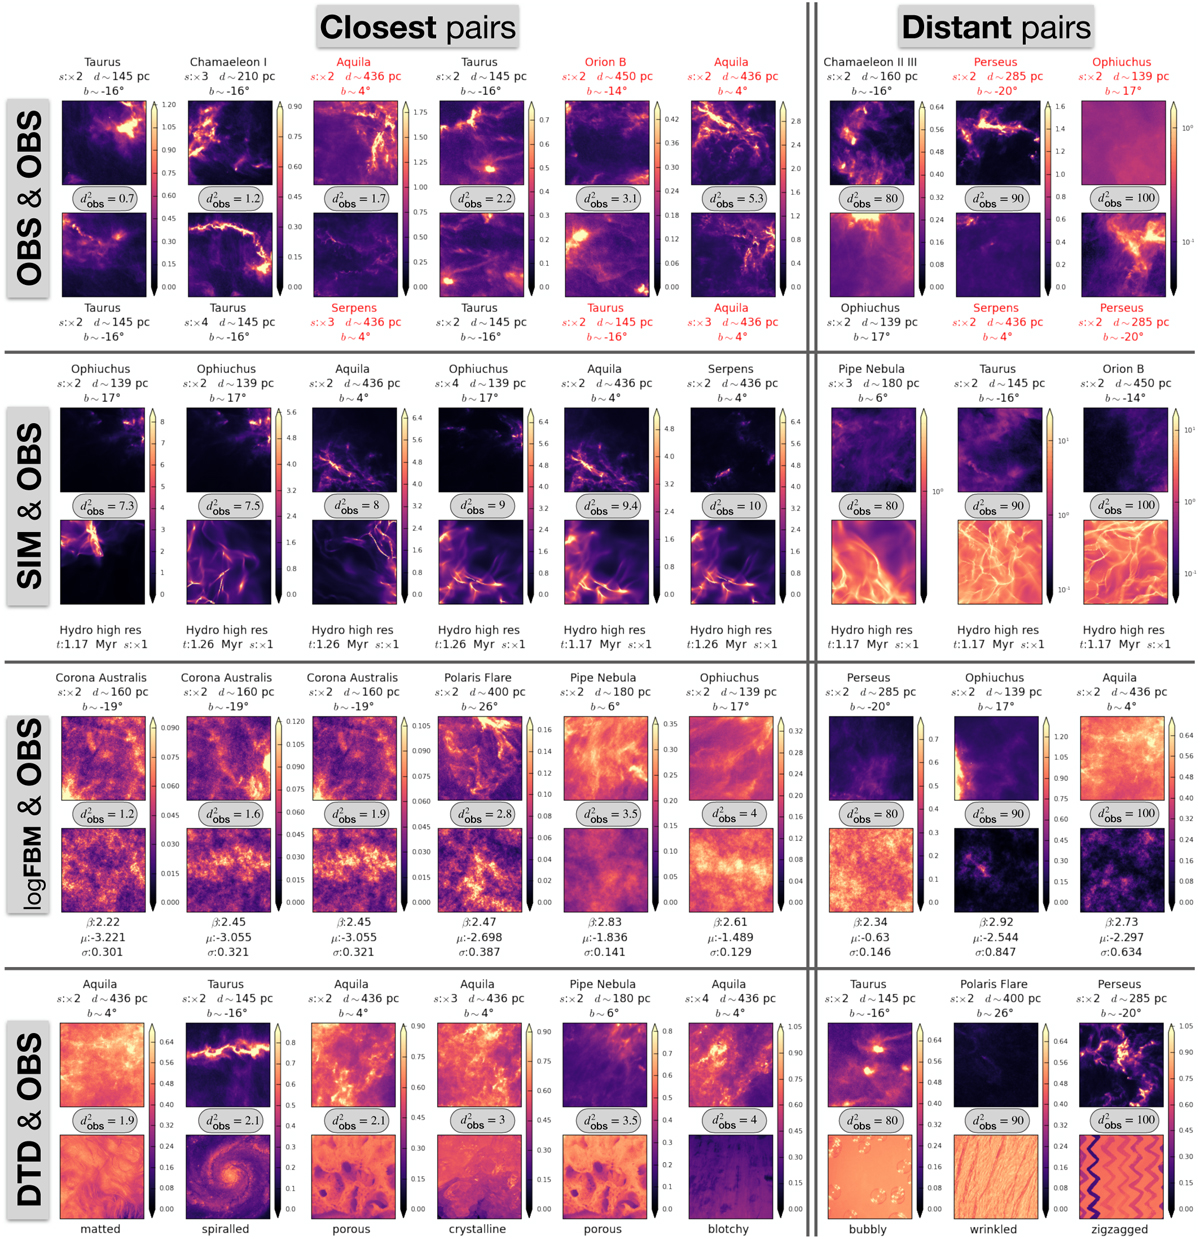
Closest (left) and more distant (right) pairs extracted from distributions of morphological distances reported in Fig. 11. Column density maps are shown in units of 1020cm−2. The colorbars can change from a pair to another. We see that the closest (OBS, SIM) pairs are much more distant ![]() than the closest (OBS, OBS) pairs (
than the closest (OBS, OBS) pairs (![]() ). See Sect. 6.3 for more detailed interpretation on these results. Some logFBM models end up quite close to the most diffuse regions observed: Polaris Flare and Corona Australis. Such regions are highly contaminated by CIB emission. Many (OBS, DTD) pairs are found to be close whereas the textures look very different. This shows that the set of summary statistics developed in this paper is tuned for ISM observations but is far from being sufficient for any kind of data. This also illustrates that MCs have much more regularity in terms of morphology than DTD textures.
). See Sect. 6.3 for more detailed interpretation on these results. Some logFBM models end up quite close to the most diffuse regions observed: Polaris Flare and Corona Australis. Such regions are highly contaminated by CIB emission. Many (OBS, DTD) pairs are found to be close whereas the textures look very different. This shows that the set of summary statistics developed in this paper is tuned for ISM observations but is far from being sufficient for any kind of data. This also illustrates that MCs have much more regularity in terms of morphology than DTD textures.
Current usage metrics show cumulative count of Article Views (full-text article views including HTML views, PDF and ePub downloads, according to the available data) and Abstracts Views on Vision4Press platform.
Data correspond to usage on the plateform after 2015. The current usage metrics is available 48-96 hours after online publication and is updated daily on week days.
Initial download of the metrics may take a while.