Fig. 11
Download original image
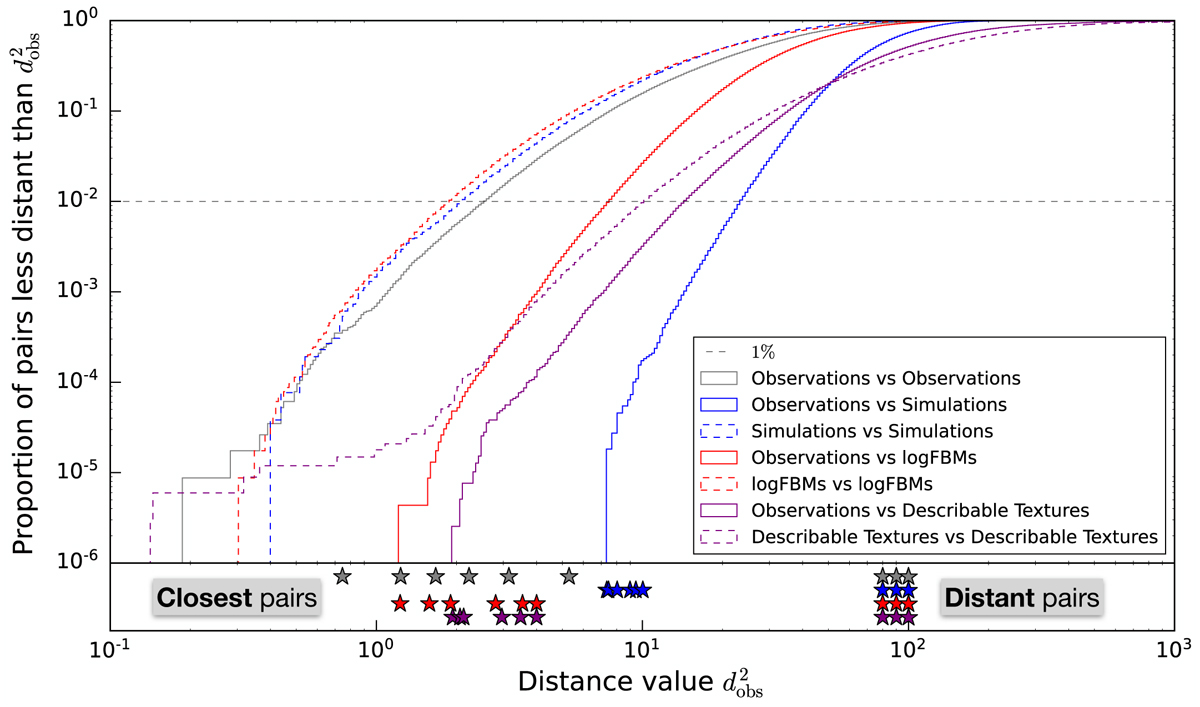
Cumulative distributions of ![]() morphological distances between pairs extracted from multiple datasets. The different curves correspond to different choices of datasets from which the two patches of a given pair are extracted. This distance is based on ϕfinal, a set of 17 coefficients (seven log-Gaussian descriptors and ten RWST statistics). The same metric Mobs is used for all distances and is defined based on the observational dataset. The stars in the bottom sub-panel correspond to “close” and “distant” pairs shown in Fig. 12. An horizontal line at the value 1% is drawn to represent the proportion of pairs of neighboring patches in the sky. These pairs made of patches with strong statistical dependence are likely to lead to an underestimated distance with respect to the other pairs. While these corrupted pairs might significantly affect the gray curve below this horizontal line, they can only have a negligible influence above that line. Same applies for pairs of simulations (blue dashed curve).
morphological distances between pairs extracted from multiple datasets. The different curves correspond to different choices of datasets from which the two patches of a given pair are extracted. This distance is based on ϕfinal, a set of 17 coefficients (seven log-Gaussian descriptors and ten RWST statistics). The same metric Mobs is used for all distances and is defined based on the observational dataset. The stars in the bottom sub-panel correspond to “close” and “distant” pairs shown in Fig. 12. An horizontal line at the value 1% is drawn to represent the proportion of pairs of neighboring patches in the sky. These pairs made of patches with strong statistical dependence are likely to lead to an underestimated distance with respect to the other pairs. While these corrupted pairs might significantly affect the gray curve below this horizontal line, they can only have a negligible influence above that line. Same applies for pairs of simulations (blue dashed curve).
Current usage metrics show cumulative count of Article Views (full-text article views including HTML views, PDF and ePub downloads, according to the available data) and Abstracts Views on Vision4Press platform.
Data correspond to usage on the plateform after 2015. The current usage metrics is available 48-96 hours after online publication and is updated daily on week days.
Initial download of the metrics may take a while.