Fig. 1
Download original image
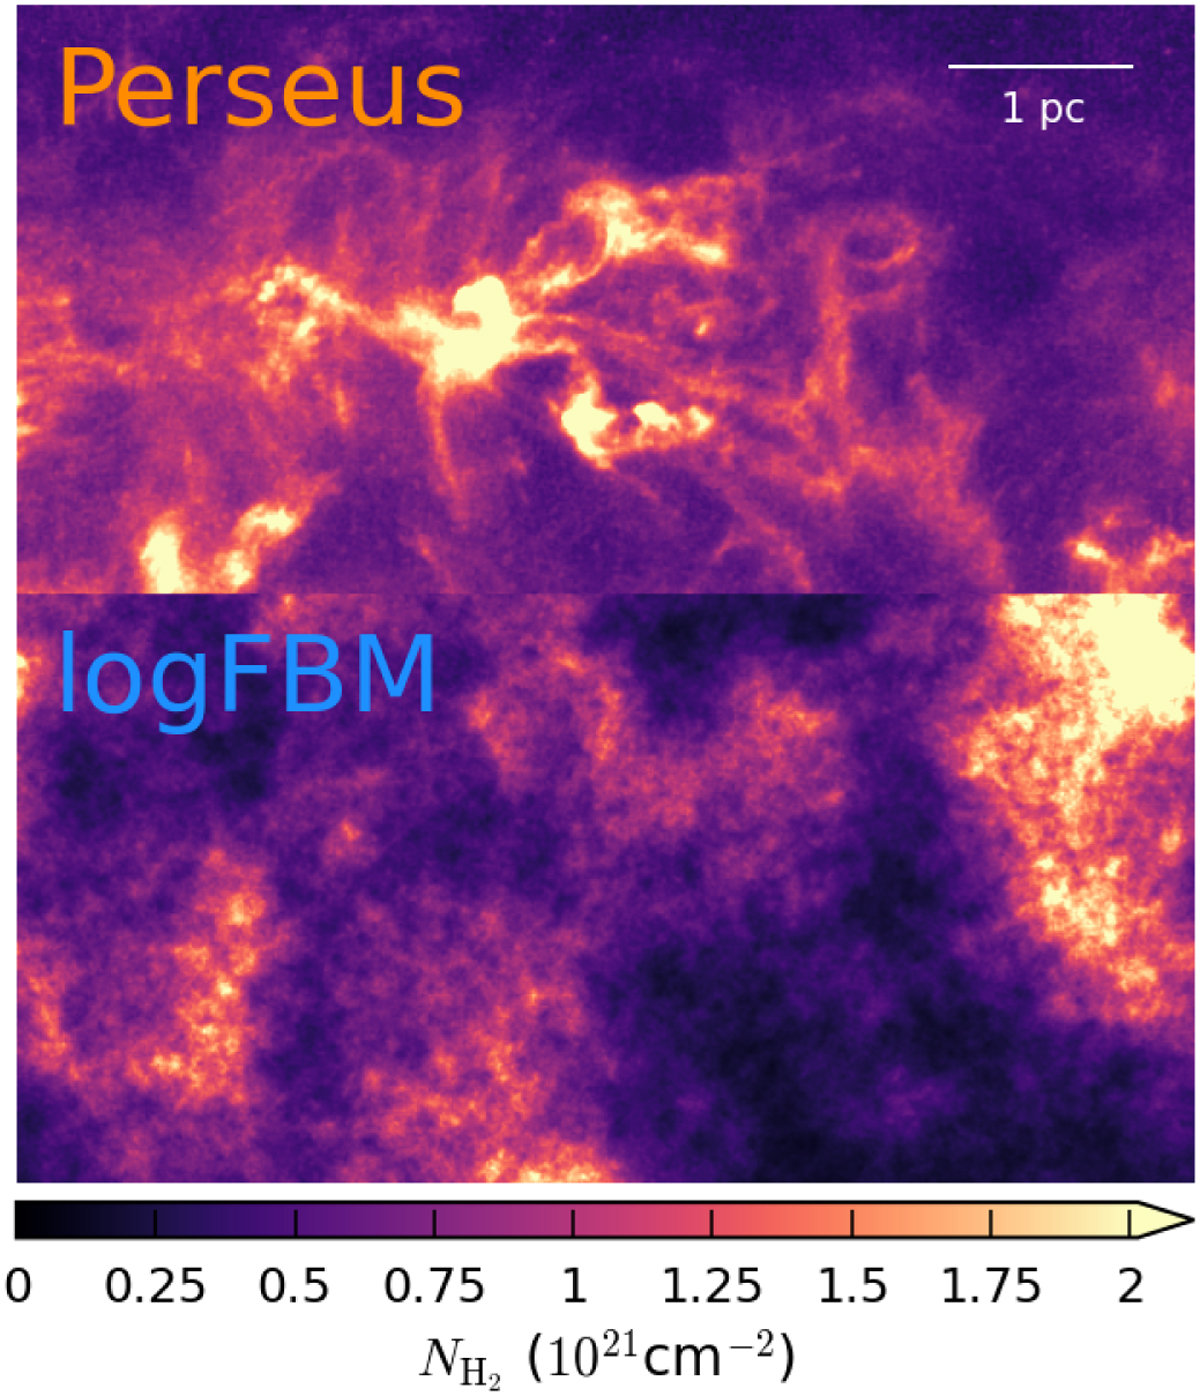
Column density map of a region in Perseus (top row) and sample of a log-fractional Brownian motion (logFBM) field (bottom row). Each image has 256 × 512 pixels but is tiled into two complementary patches of size 256 × 256 on which the statistics shown in Fig. 2 are computed. While these one-point and two-point statistics (some being non-Gaussian) are clearly compatible, these two images have manifestly different morphologies.
Current usage metrics show cumulative count of Article Views (full-text article views including HTML views, PDF and ePub downloads, according to the available data) and Abstracts Views on Vision4Press platform.
Data correspond to usage on the plateform after 2015. The current usage metrics is available 48-96 hours after online publication and is updated daily on week days.
Initial download of the metrics may take a while.