| Issue |
A&A
Volume 696, April 2025
|
|
|---|---|---|
| Article Number | A104 | |
| Number of page(s) | 12 | |
| Section | Interstellar and circumstellar matter | |
| DOI | https://doi.org/10.1051/0004-6361/202348252 | |
| Published online | 08 April 2025 | |
Episodic outbursts during brown dwarf formation
1
Anton Pannekoek Institute for Astronomy, University of Amsterdam,
Amsterdam
1098 XH, The Netherlands
2
Jeremiah Horrocks Institute for Mathematics, Physics & Astronomy, University of Central Lancashire,
Preston
PR1 2HE, UK
3
Universitäts-Sternwarte München, Ludwig Maximilians Universität,
Scheinerstraβe 1,
81679
München, Germany
★ Corresponding author; This email address is being protected from spambots. You need JavaScript enabled to view it.
Received:
12
October
2023
Accepted:
27
February
2025
Abstract
Aims. There is evidence that stars and browns dwarfs grow through episodic rather than continuous gas accretion. However, the role of episodic accretion in the formation of brown dwarfs remains mostly unexplored. We investigate the role of episodic accretion, triggered by the magnetorotational instability in the inner disk regions, resulting in episodic outbursts during the formation of brown dwarfs, and its implications for their early formation stages.
Methods. We used hydrodynamical simulations coupled with a sub-grid accretion model to investigate the formation of young protobrown dwarfs and protostars, taking into account the effects of episodic accretion resulting in episodic radiative feedback – namely, luminosity outbursts.
Results. The formation timescale for proto-brown dwarfs is at least one order of magnitude shorter than that of protostars. Episodic accretion leads to a shorter main accretion phase compared to continuous accretion in brown dwarfs, whereas the opposite is true for low-mass stars. Episodic accretion can accelerate early mass accretion in proto-brown dwarfs and protostars, but it results in less massive objects by the end of the main phase compared to continuous accretion. We find an approximately linear correlation between an object’s mass at the end of the main accretion phase and the timing of the last episodic outburst: later events result in more massive brown dwarfs but less massive low-mass stars. Episodic outbursts have a stronger effect on brown dwarf-forming cloud cores, with the last outburst essentially splitting the brown dwarf evolution into a short high-accretion and a much longer low-accretion phase.
Key words: accretion, accretion disks / hydrodynamics / radiative transfer / brown dwarfs / stars: formation
© The Authors 2025
 Open Access article, published by EDP Sciences, under the terms of the Creative Commons Attribution License (https://creativecommons.org/licenses/by/4.0), which permits unrestricted use, distribution, and reproduction in any medium, provided the original work is properly cited.
This article is published in open access under the Subscribe to Open model. This email address is being protected from spambots. You need JavaScript enabled to view it. to support open access publication.
1 Introduction
Star formation occurs in dense cores within molecular clouds. Low-mass protostars grow in mass by accreting gas from the collapsing molecular cloud. Since the contracting cloud contains a substantial amount of angular momentum, the infalling gas forms an accretion disk around the protostar (Shu et al. 1987). If a reliable viscosity-generating mechanism exists to transport angular momentum outward in the disk, the disk’s material spirals inward, while gravitational energy is being transformed to radiation and internal energy. Mechanisms that can provide a viscosity in the disk are the gravitational instability (GI) (e.g., Lodato & Rice 2004) and the magneto-rotational instability (MRI) (Balbus & Hawley 1998).
Despite this broad picture, a detailed physical understanding of the accretion process during the proto-stellar stage, when the forming star is still embedded within and accreting from its parent dense core, remains elusive. In the simplest model of star formation, the collapse of a singular isothermal sphere, mass accretes onto the protostar at a constant rate of ~2 × 10⁻⁶ M⊙ yr−1 (Shu et al. 1987). However, as Kenyon et al. (1990) first discussed, most protostars have luminosities that are significantly lower than the accretion luminosity expected from accretion at this rate. This luminosity problem has been highlighted by Spitzer Space Telescope (Werner et al. 2004) observations of nearby star-forming regions, which reveal a significant population of protostars with luminosities lower than these theoretical predictions (e.g., Evans et al. 2009; Dunham et al. 2015).
There is growing evidence that episodic rather than continuous mass accretion is the solution to the luminosity problem, with long periods of very low accretion punctuated by short bursts of rapid accretion (resulting in luminosity outbursts) (Audard et al. 2014; Herczeg et al. 2017; Mercer & Stamatellos 2020; Fischer et al. 2023). The luminosities during the periods of low accretion predicted by simulations (Dunham & Vorobyov 2012; Stamatellos et al. 2012; Vorobyov & Basu 2015) do indeed match the observed proto-stellar luminosity distribution and can alleviate the luminosity problem.
An open question in star formation is whether the formation and evolutionary stages of substellar mass, that is, brown dwarfs (BDs) (0.013 M⊙ ≤ M ≤ 0.08 M⊙) and planetary-mass objects (≤0.013 M⊙) are comparable to those of low-mass stars. In order to unravel this mystery, a combination of theoretical models and observations of young BDs in their most embedded stages of their formation (comparable to the Class 0/I stages of low-mass star formation, here called proto-BDs) is essential. Despite the fact that numerical simulation studies have provided insight into the various brown dwarf formation processes, for example, whether it is a star-like formation via gravitational core collapse (Machida et al. 2009) or alternative mechanisms of formation via disk fragmentation or as ejected embryos (Goodwin & Whitworth 2007; Stamatellos & Whitworth 2009; Bate 2012; Mercer & Stamatellos 2017; Mercer & Stamatellos 2020), the number of observed proto-BDs candidates remains small.
Observations of Class 0/I brown dwarf candidates (Palau et al. 2014; Morata et al. 2015; Riaz et al. 2015; Riaz et al. 2024) suggest that the formation of these systems can be explained by a scaled-down version of star formation. In more recent years, telescopes such as Atacama Large Millimeter/submillimeter Array (ALMA) have allowed us to spatially resolve the inner few au scales of these very low luminosity objects (VeLLOs) and constrain theoretical models (Lee et al. 2018). Observations have revealed features, such as infalling envelopes, rotationally supported pseudo-disks, and outflow-driving areas (Riaz et al. 2017, 2019; Riaz & Machida 2021), that are similar to those found in proto-stellar systems. The bolometric luminosity of these objects is generally ≤0.1 L⊙, while mean accretion rates range from ~10−6 to ~10−8 M⊙ yr−1 (Riaz & Bally 2021).
Observations of the formation of proto-BDs are quite challenging. The physical scales of early-stage Class 0/I brown dwarfs are estimated to be at least 10 times smaller than those of low-mass protostars (Machida et al. 2009; Riaz et al. 2019). Furthermore, the main accretion phase, that is, the duration of the Class 0 and Class I phases combined, significantly differs between brown dwarfs and low-mass stars. The envelope dissipation timescale is predicted to be quite brief, ≲104 yr, in the formation of brown dwarfs, according to simulations performed by Machida et al. (2009); Machida & Matsumoto (2012). In contrast, protostars with ages of less than 0.1 Myr have been shown observable signs of infall from an envelope (Takakuwa et al. 2012; Davidson et al. 2011), while Dunham et al. (2015) estimate lifetimes of 0.13–0.26 Myr for the Class 0 phase and 0.27–0.52 Myr for the Class I phase.
In most previous theoretical studies, a continuous gas accretion is assumed onto the proto-BD. However, in the inner few au, the gas can be hot enough to be thermally ionized and couple with magnetic fields activating the MRI (e.g., Zhu et al. 2009, 2010). As a result, the accretion can be episodic, switching between periods of enhanced and quiescent accretion when the MRI is active or not, respectively, just as it happens on solar-mass stars. Episodic accretion may also be due to infalling fragments that formed due to GI (e.g., Vorobyov & Basu 2005, 2010, 2015), or due to thermal instability in the inner disk region (Bell et al. 1995).
Stamatellos et al. (2011); Stamatellos et al. (2012) examine the role of episodic accretion on disk fragmentation around young solar-mass stars, regulating the number of low-mass stars and BDs forming (see also Mercer & Stamatellos 2017). Lomax et al. (2014, 2015) show that episodic accretion is necessary for reproducing the initial mass function (IMF) of stellar clusters, as continuous accretion leads to a lack of low-mass stars and BDs. MacFarlane & Stamatellos (2017) and Vorobyov et al. (2020) study the effect of episodic outbursts on the structures of pro- tostellar disks. MacFarlane et al. (2019a,b) discuss the expected observational signatures of episodic accretion/outbursts around young stars.
The role of episodic accretion during the formation of proto-BD remains mostly unexplored. Observations of multiple shocked emission knots at the extended jet (HH1165) of the very low-luminosity Class I candidate proto-BD Mayrit 1701117 (Riaz et al. 2017, 2019) indicate that episodic accretion events may also happen during brown dwarf formation.
In this paper, we use the Smoothed Particle Hydrodynamics (SPH) code SEREN (Hubber et al. 2011) to simulate the effect of episodic accretion/episodic outbursts during brown dwarf formation via the gravitational collapse of a very low-mass pre-BD core. We probe the evolution of the proto-BD until the end of the main accretion phase (Machida et al. 2009), examining the role of the timescale of outbursts and the interval between them. We discuss the observational implications of our models and compare our results with the proto-brown dwarf observations of Riaz & Machida (2021). Additionally, we compare the results of simulations of BD formation with those of low-mass star formation.
2 Computational method
We use the Smoothed Particle Hydrodynamics code SEREN (Hubber et al. 2011) to treat the gas hydro- and thermodynamics. The code uses a 2nd-order Runge-Kutta integration approach, multiple particle time-steps, and an octal tree to compute gravitational forces and find particle neighbors. In order to decrease artificial shear viscosity, the code employs timedependent artificial viscosity (Morris & Monaghan 1997) with parameters αmin = 0.1, β = 2α, and a Balsara switch (Balsara 1995).
The Stamatellos et al. (2007) technique is used to treat the chemical and radiative processes that control gas temperature (see also Forgan et al. 2009; Mercer et al. 2018). The technique accounts for radiative cooling/heating, viscous heating, background radiation field heating, and compressional heating. The equation of state takes into account the rotational and vibrational degrees of freedom of molecular hydrogen, as well as the various chemical states of hydrogen and helium (Boley et al. 2007). It is assumed that the gas is a mixture of 70% hydrogen and 30% helium. The dust and gas opacity is set to κ(ρ, T) = κ0ραTβ, where κ0, α, β are constants (Bell et al. 1995) that depend on the physical processes causing the opacity, such as dust sublimation, ice mantle melting, molecular contributions, and H− contributions.
The self-gravitating gas dynamics, energy equation, and related radiation transport are treated explicitly up to densities of ρ = 10−9 g cm−3 . It is assumed that a gravitationally confined condensation with ρ > 10−9 g cm−3 will eventually develop into a bound object (protostar or proto-BD). At this point, a sink (Bate et al. 1995), with a radius of 1 au, replaces the condensation to avoid very short time-steps. Only the sink’s gravity and luminosity affects the rest of the computational domain. Gas, that flows within the sink radius and is bound to it, is added to the sink’s mass. A forming proto-BD will provide radiative feedback to the surrounding environment, setting the pseudo-background radiation field, that is, a minimum temperature floor under which the gas cannot cool radiatively (for details see Stamatellos et al. 2007; Mercer & Stamatellos 2017) that is set to
 (1)
(1)
where L and rsink are the luminosity and the position of the proto-BD, respectively. The luminosity at the early stages that we model is due to gas accretion onto the object, and is given by
 (2)
(2)
where MBD is the mass of the proto-BD, RBD its radius and ṀBD the accretion rate onto it. f = 0.75 is the fraction of the accretion energy that is radiated away at the photosphere of the proto-BD, rather than being expended, for instance, in driving jets and/or winds (Shang et al. 2007; Offner et al. 2010; Stamatellos et al. 2012). We assume RBD = 3 R⊙ which is the typical radius of a young forming object (Palla & Stahler 1993; Bate 2011). The background temperature profile is variable (see Eqs. (1) and (2)). It depends on the accretion rate onto the proto-BD and on the distance from it, TBGR ∝ r−2, which is the anticipated radial temperature profile on an envelope around a luminosity source.
3 Model setup
3.1 A semi-analytical model of episodic accretion
We use the model of Stamatellos et al. (2011) to include the effect of episodic accretion (resulting in episodic radiative feedback, i.e., in luminosity outbursts) on a forming proto-BD. The model uses a sub-grid model to describe the region within a sink SPH particle. Here, we briefly describe the basic aspects of the model that are needed to interpret the results of our simulations. More details of the model are given in Stamatellos et al. (2011); Stamatellos et al. (2012). We assume that the MRI develops in the inner region (<1 AU) around BDs the same way it does around solar-mass stars. It is therefore assumed that the density and temperature conditions very close to the BDs are appropriate for this to happen (Bae et al. 2014).
The model assumes that the sink consists of the proto- BD (MBD) and an inner accretion disk (IAD; MIAD) which is notionally the part of the disk that is not resolved by the SPH simulation. Gas that is accreted onto the sink, first is deposited on the IAD and then spirals toward the proto-BD according to the local disk viscosity. When the viscosity is low, gas piles up in the IAD until the temperature rises to the point where thermal ionization couples the matter to the magnetic field. The temperature at which this occurs is set to TMRI ~ 1400 K. At this point, the MRI is triggered, moves angular momentum outward and the IAD gas spirals inward and onto the central proto-BD. The accretion rate onto the proto-BD is
 (3)
(3)
where ṀBGR is the quiescent accretion rate from the lAD to the proto-BD, whereas ṀMRI is a significantly greater accretion rate that only occurs when the MRI operates.
The MRI is activated when enough mass has accumulated in the IAD, thus
 (4)
(4)
where
 (5)
(5)
αMRI is the effective Shakura-Sunyayev parameter (Shakura & Sunyaev 1973) for the MRI-provided viscosity, and ΔtMRI is the duration of the episodic event
 (6)
(6)
where ṀIAD is the accretion rate onto the sink and onto the IAD.
Using Equations (4), (5) and (6), the condition for the MRI activation becomes
 (7)
(7)
To match observations of FU Ori-type outbursts the accretion rate during the outburst is set to exponentially drop as
 (8)
(8)
where t0 marks the start of the event. After the IAD empties, the time taken to re-accumulate enough gas for another episodic accretion event is Δtacc ~ MMRI /ṀIAD, thus
 (9)
(9)
There are two free parameters in the model: (i) the viscosity parameter provided by the MRI, αMRI , and (ii) the quiescent accretion rate, ṀBGR. The first, regulates the intensity and duration of the outburst; raising αMRI results in a shorter (Eq. (6)), more intense outburst (Eq. (2)). ṀBGR takes over as the dominant mode of gas accretion onto the proto-BD when the MRI is inactive (Eq. (3)). The values of αMRI and ṀBGR are uncertain.
3.2 BD formation – initial conditions
We simulate the collapse of a low-mass molecular cloud core so that the central object forming is a BD rather than a star. The initial density profile of the cloud is
 (10)
(10)
where ρc = 2 × 10⁻¹⁴ g cm−3 is the central density and Rkernel = 21 au is the radius of the core where the density is roughly uniform. The core extends to Rcore = 500 au and its total mass is Mcore = 0.087 M⊙. The initial ratio of the rotational to gravitational energy is βrot = Urot/|Ugrav| = 0.01. The initial temperature of the gas is Tgas = 10 K and thus the initial ratio of thermal to gravitational energy is αthermal = Uthermal /|Ugrav | = 0.41. We assume that the cloud core does not have any turbulence.
The cloud core is represented by 3 × 10⁵ SPH particles, thus each particle has mass mparticle = 3 × 10⁻⁷ M⊙. The minimum mass that can be resolved is therefore Mmin = Nneibmparticle = 1.8 × 10⁻⁵ M. This is two orders of magnitude smaller than the opacity limit for fragmentation, that is, the theoretical minimum mass for star formation, ~10−3 M⊙ (e.g. Whitworth & Stamatellos 2006), thus the self-gravitating condensations are well resolved.
We perform seven simulations with the same cloud initial conditions. In six of them, we vary the parameters aMRI and ṀBGR, which control the episodic accretion/episodic outburst events. In the remaining one, the episodic accretion model is inactive, hence the accretion and the associated radiative feedback are continuous. Observations and simulations of proto- planetary disks around low-mass stars suggest αMRI ∈ [0.01, 0.4] (King et al. 2007; Isella et al. 2009; Bae et al. 2014; Kadam et al. 2020; Jankovic et al. 2021). In this work, we choose αMRI = [0.01, 0.1, 0.3]. The accretion rate onto Class0/I proto-BD candidates (Palau et al. 2014; Riaz et al. 2015; Lee et al. 2018; Riaz & Bally 2021) are thought to be ṀBGR ∈ [10−6, 10−9] M⊙ yr−1, thus we chose four values in this range. In Table 1, we summarize the initial conditions of our simulations.
4 Episodic accretion during brown dwarf formation
All simulations run for t = 100 kyr. In Fig. 1, we present the results of the simulations for different αMRI (runs 1–3), and in Fig. 2 the results of the simulations for different ṀBGR (runs 2, 4–6). In both figures, we also include the results of the simulation with continuous accretion, where the episodic accretion model is inactive (run 7). It is important to note that the proto-BD and the IAD are not defined for run 7.
The collapsing cloud core forms a sink at t ~ 1.85 kyr, hence a proto-BD with an inner accretion disk is acquired. The sink’s initial mass is Msink,1.85kyr = 0.0026 M⊙ At first, the sink accretes vigorously, with ṀIAD ~ 7.8 × 10⁻⁵ M⊙ yr−1, but the accretion rate decreases as the available cloud mass is reduced. Following the formation of a sink, gas begins to accumulate in the IAD before accreting onto the proto-BD. When MRI is inactive, the forming proto-BD accumulates mass at a constant ṀBGR rate. Once the MRI is triggered, ṀBD rises up by ~4–6 orders of magnitude, and the IAD deposes intensively its mass on to the forming proto-BD (see Figs. 1 and 2). After the end of the event, the IAD fills up until the next episodic accretion event.
Accretion on to the proto-BD releases energy (Eq. (2)). When the MRI is inactive, the forming object’s luminosity remains constant and ≤0.1 L⊙. However, during episodic accretion events, the luminosity dramatically increases and then declines exponentially until the event ends. The young proto-BD exhibits outbursts during the first few kyr of its life, but no outbursts occur after t = 20 kyr, because the majority of the cloud core mass has already been accreted onto the forming object. The exception is run 5, where the last outburst occurs at t ~ 80 kyr. It is therefore expected that outbursts from BDs happen within a relatively short timescale, making their discovery difficult.
In the continuous accretion case (run 7) the evolution of gas accretion is different. Initially, the sink accretes at similar rates as in other models, and the accretion rate gradually declines as the available cloud mass decreases. However, in runs with episodic accretion (1–6) the accretion rate onto the sink shows a significant drop after the last outburst, and during the subsequent evolution (except for run 5). Furthermore, in the continuous accretion run the object displays a higher luminosity than models 1–6, a pattern that is temporarily disrupted when MRI is active and an outburst occurs. Figure 3 illustrates two snapshots of the disks around the forming BD for run 2 and run 7, respectively. For continuous accretion, the higher luminosity results in a hotter and thus thicker disc. Nevertheless, the total energy emitted during each run is on the same order of magnitude, Etotal ~ 1045 erg. Episodic accretion distributes the total emitted energy into short bursts, allowing for long periods of low luminosities of proto-brown dwarfs.
Radiative feedback directly affects the accretion onto the sink, because it heats the gas, leading to a thicker disc. Consequently, the surface density drops (Fig. 3) and accretion is delayed or even temporary suppressed (e.g. Mercer & Stamatellos 2017). This is evident in Fig. 2 (2nd row, inset), where the accretion rate onto the IAD/sink drops during each outburst, but after the radiative feedback is terminated, the gas cools down quickly and the accretion rate increases again. For a longer episodic feedback, the accretion onto the sink decreases for a longer period of time. As a result, the duration and the time between successive outbursts affects the sink’s growth during the early stage of formation. In the next subsections, we explore the effect of the models’ parameters on the duration and the time intervals between successive outbursts, and the overall evolution of the BD.
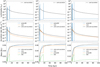 |
Fig. 1 Luminosity of the central object, accretion rate onto the sink and proto-BD, and the masses of the proto-BD, IAD, and sink (i.e., proto-BD + lAD mass) (top to bottom row) for runs 1–3 (left to right column); see also Table 1. The black line shows the luminosity, the accretion rate onto the sink and its mass for run 7. |
Simulation parameters for BD formation.
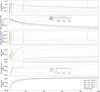 |
Fig. 2 Luminosity of the central object, accretion rate onto the sink and proto-BD, and the masses of the proto-BD, IAD and sink (i.e., proto-BD + lAD mass) for runs 2, 4–6 (top to bottom row); see also Table 1. The black line shows the luminosity, the accretion rate onto the sink and its mass for run 7. |
4.1 The effect of increasing aMRI
In Figure 4, we present the duration of successive outbursts for different viscosity parameter αMRI values during the first 20 kyr of the simulation, as no episodic event occurs after ~17 kyr. The duration of the episodic events decreases, with increasing αMRI. As briefly explained in Sect. 3, when the MRI is active, the viscosity parameter αMRI regulates how quickly matter accretes onto the proto-BD; the greater αMRI, the more quickly angular momentum can be transferred outward through the IAD and the faster matter accretes onto the proto-BD. For αMRI = 0.01 the duration of the shortest is ~156 yr; while, for αMRI = 0.3, the duration of the lengthiest event is just ~20 yr. Consequently, the duration of the respective outbursts decreases as αMRI increases (see also Eq. (6)).
In Figure 5, we plot the time intervals between successive outbursts. For a given αMRI value, these intervals increase as the system evolves. This is because the mass of the proto-BD (MBD) increases over time, while the accretion rate onto the sink (ṀIAD) decreases (Eq. (9)).
Additionally, with increasing αMRI , we observe two trends: (1) the total number of episodic events increases, and (2) the time intervals between successive outbursts decrease. Higher αMRI values are associated with shorter outbursts and, therefore, reduced periods of radiative feedback. This reduction allows the accretion rate onto the IAD/sink (ṀIAD) to decrease initially but recover over shorter timescales. As a result, the IAD can re-accumulate gas more rapidly, leading to subsequent bursts on shorter timescales. For instance, the time intervals between the first and the second events are ~1432 yr and ~369 yr, for αMRI = 0.01 and αMRI = 0.3, respectively. Therefore, shorter outbursts lead to shorter time intervals between successive outbursts, ultimately resulting in a greater number of events.
During an episodic accretion event, the accretion rate onto the proto-BD increases. Higher values of αMRI result to a more significant increase of the accretion rate onto the proto-BD (see 2nd row in Fig. 1 and Eq. (8)). For αMRI = 0.01 the accretion rate onto the proto-BD reaches a value of ~9 × 10⁻⁵ M⊙ yr−1, while for αMRI = 0.3, maximizes at ~2 × 10⁻² M⊙ yr−1. Despite the fact, that αMRI determines how quickly matter accretes onto the proto-BD, the amount of mass that is delivered onto the proto- BD is not directly dependent on αMRI (Eq. (7)); nevertheless, a shorter event duration results to a more intense outburst. Hence, for greater, αMRI the outburst brightness is also higher (Eq. (2)). For αMRI = 0.01 the luminosity of the proto-BD maximizes at LBD ~ 18 L⊙ and lasts ~533 yr (see Fig. 1). For αMRI = 0.3 the luminosity reaches up to LBD ~ 462 L⊙, but the duration of the event is < 20 yr, and therefore statistically difficult to be observed.
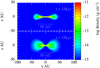 |
Fig. 3 Cross section of the density on the x − ɀ plane showing the disk (edge-on view) at t = 15 kyr, which forms around the proto-BD in run 2 (episodic accretion; top) and in run 7 (continuous accretion; bottom). |
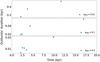 |
Fig. 4 Effect of increasing αMRI on the duration of episodic outbursts for runs 1–3; see also Table 1. |
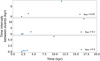 |
Fig. 5 Effect of increasing αMRI on the time intervals between successive episodic outbursts for runs 1–3; see also Table 1. |
4.2 The effect of increasing ṀBGR
The quiescent accretion rate, ṀBGR, regulates the growth of the sink and the amount of energy released, when MRI is inactive (see Fig. 2 and Eq. (3)); higher ṀBGR values, correspond to higher brightness released by the proto-BD. In Figure 2, we see that the sink accretion rates, the IAD and the proto-BD mass converge independently of the ṀBGR value for runs 2, 4 and 6, except for run 5.
In Figures 6 and 7, we present the duration of successive outbursts and the time intervals between consecutive outbursts for runs 2, 4, 5 and 6, respectively. The duration of the respective outbursts varies by ≤15 yr for varied ṀBGR, and so the duration of the outbursts is mainly independent of ṀBGR . The time intervals between successive outbursts vary also by ≤15 yr for varied ṀBGR, except for run 5. For the latter, the third outburst, takes place at ~2.8 kyr, and the subsequent evolution differs from the rest runs (see subset in Fig. 7). In runs 2, 4 and 6, four episodic accretion events occur no later than ~20 kyr, while in run 5 we encounter five events with the last one taking place at t ~ 80 kyr.
Overall, the duration of episodic outbursts is largely independent of ṀBGR , while this parameter may affect the time intervals between episodic outbursts. However, this seems to be indirect and at least one order of magnitude less important than the effect of αMRI . In the next sections, we constrain ourselves to the models for different αMRI values, runs 1–3, and we explore the implications of episodic accretion in the formation of BDs.
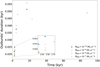 |
Fig. 6 Effect of increasing ṀBGR on the duration of episodic outbursts for runs 2, 4–6; see also Table 1. |
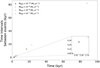 |
Fig. 7 Effect of increasing ṀBGR on the time intervals between successive episodic outbursts for runs 2, 4–6; see also Table 1. |
4.3 Episodic accretion during the main accretion phase of BD formation
We investigate the implications of episodic accretion in the very early stages of BD formation. We focus on the timescale of the main accretion phase, which corresponds to the Class 0/I stages of low-mass star formation. We define the main accretion phase as the timescale on which the accretion rate onto the sink has decreased by ~3 orders of magnitude, similar to Machida et al. (2009). In Figure 8, we present the results for runs 1–3, 7.
The duration of the main accretion phase increases, with increasing αMRI, as seen in Fig. 8. Higher αMRI values correspond to shorter but more intense events (see also Figs. 6 and 1). Furthermore, the time intervals between successive events shorten as αMRI increases, while the total number of events increases (see Fig. 7). As a result, we argue that, despite the larger number of high-accretion events, the presence of less significant but longer ones, combined with prolonged but less intense radiative feedback, leads to shorter timescales for the main accretion phase in BD formation.
Additionally, Fig. 8 shows that, regardless of the αMRI values, the main accretion phase of the episodic accretion models 1–3 is shorter than in the continuous accretion model (run 7). In Figure 1, we see that the sink particles in runs 1–3 gain mass more rapidly (at the expense of the envelope) than the sink in run 7 during the early stages of formation, Δt ≤ 20 kyr. During these early episodic events, Msink ≪ Mcore, and after the radiative feedback from an event ends, the accretion rate onto the sink rises again to values similar to those in the continuous accretion model. However, following the final event, a clear divergence occurs. By this point, the majority of the available mass has been accreted onto the sink, while the remaining low-mass core is heated by radiative feedback, causing a significant drop in the accretion rate. Notably, the accretion rate in model 3 rises slowly afterwards, suggesting that there is still a non-negligible amount of gas in the core to be accreted onto the proto-BD. We conclude that episodic accretion during BD formation leads to a shorter timescale for the main accretion phase compared to continuous accretion.
In Figure 9, we present sink masses at the end of the main accretion phases as a function of the time of the last episodic event, for runs 1–3. We additionally show the sink mass at the end of the main accretion phase for run 7 and the results of Machida et al. (2009). The sink particles accumulate more mass when the final episodic event occurs later. Interestingly, this result is also consistent with runs 4–6. Finally, in the continuous accretion model (run 7) the sink accretes more mass than in the episodic accretion models (runs 1–3). In Table 2, we summarize our results. We conclude that episodic accretion accompanied by radiative outbursts results to lower overall gas accretion onto the proto-BD than continuous accretion.
From Figure 9, we see an approximately linear correlation between the sink mass at the end of the main accretion phase and the time of the last outburst. The later the final outburst occurs, the more massive the sink at the end of the main accretion phase.
We note that Machida et al. (2009) find a shorter duration for the main accretion phase (~10 kyr) but they investigate a system that is different to ours, including different physics: a rotating magnetized compact low-mass cloud (Mcore = 0.22M⊙). Therefore, such differences are to be expected; their result is used for reference only.
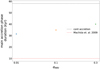 |
Fig. 8 Duration of the main accretion phase for runs 1–3, 7; see also Table 1. The black horizontal dashed line corresponds to run 7. The red horizontal dashed line corresponds to the results of Machida et al. (2009). |
Summary of episodic accretion effects on BD formation.
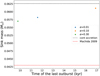 |
Fig. 9 Sink mass at the end of the main accretion phase versus time of the last outburst for runs 1–3, 7; see also Table 1. The horizontal dashed black line corresponds to run 7 (continuous accretion). The red horizontal dashed line corresponds to the results of Machida et al. (2009). |
5 Comparison of outbursting proto-BDs with outbursting low-mass protostars
5.1 Low-mass star formation – initial conditions
We investigate the impact of episodic accretion during the early stages of low-mass star formation. We simulate the collapse of a more massive molecular cloud core so that the forming central object is a protostar, rather than a proto-BD. The cloud core’s density profile is given by Eq. (10), we use ρc = 2 × 10⁻¹⁶ g cm−3, Rkernel = 215 au, and Rcore = 5500 au. Thus, the cloud’s core total mass is Mcore = 1.0 M⊙. The initial ratio of the rotational to gravitational energy is βrot = Urot/|Ugrav| = 0.01. The initial temperature of the gas is Tgas = 10 K and thus the initial ratio of thermal to gravitational energy is αthermal = Uthermal/|Ugrav| = 0.39.
The cloud core is represented by 3 × 10⁵ SPH particles, with each particle having mass mparticle = 3.35 × 10⁻⁶ M⊙. The minimum resolved mass now is Mmin = Nneibmparticle = 2.012 × 10⁻⁴ M⊙, and the self-gravitating condensations are well resolved (e.g. Whitworth & Stamatellos 2006).
We preform four simulations of the collapse of this more massive cloud. For runs 8–10, we choose ṀBGR = 10−7 M⊙ yr−1 and aMRI = 0.01, 0.1, 0.3, respectively. Run 11 corresponds to a model where accretion is continuous. In Table 3, we summarize the initial conditions for the simulations related to low-mass star formation.
Simulation parameters for low-mass star formation.
5.2 Outbursting low-mass protostars
All simulations run for t = 1.6 Myr. In Figure 10, we present the results. We observe qualitatively similar behavior for protostars as seen for proto-BDs (see Sect. 4), though the timescales differ. The collapsing core forms a sink at t ~ 15.26 kyr, after which a protostar with an inner accretion disk is acquired. The sink’s initial mass is Msink,15.26kyr = 0.0048 M⊙. The young protostars undergo 7, 10, and 15 episodic accretion events, accompanied by outbursts, for aMRI = 0.01, 0.1, 0.3, respectively. The majority of these events occur within the first 150 kyr after the sink formation, with the final two and three events happening later for aMRI = 0.1 and 0.3, respectively.
In all simulations, the sink initially accretes vigorously with ṀIAD ~ 4 × 10⁻⁵ M⊙ yr−1, with ṀIAD gradually decreasing over time. Each outburst is marked by a temporary drop in the sink’s accretion rate due to a decrease in the disk surface density (see Fig. 11). During the quiescent accretion phases, the luminosity mostly remains within the range of [0.1–1] L⊙. However, during episodic accretion events, it spikes up. Higher values of aMRI result in more intense episodic outbursts, a trend similar to that observed in forming BD (see Fig. 1).
The continuous accretion model (run 11) differs from the episodic accretion models (runs 8–10) during low-mass star formation, in a manner similar to its behaviour during BD formation. Initially, the sink accretes at comparable rates across all simulations, but the accretion rate gradually declines as the available cloud core mass is depleted. Run 11 exhibits higher luminosity than models 8–10, except during outbursts, resulting in a hotter and thus also thicker disc, as can be seen in Fig. 11. Nevertheless, the total energy emitted during each run is approximately the same, Etotal ~ 1047 erg. Thus, we conclude that episodic accretion in low-mass star formation distributes the total emitted energy in a manner analogous to BD formation.
In Figures 12 and 13, we present the time duration and time intervals between successive outbursts during the first 1.1 Myr of the simulation, as no episodic event occurs afterwards. Higher values of aMRI lead to shorter outbursts and shorter time intervals between successive events during low-mass star formation. For example, the shortest event lasts ~144 yr for αMRI = 0.01, whereas the longest outburst for αMRI = 0.3 lasts only~ 107 yr. Additionally, for αMRI = 0.01, the time interval between the third and the fourth event is ~4217 yr. However, for αMRI = 0.1 and αMRI = 0.3, the time intervals between the third and the fourth events are ~1316 and ~328 yr, respectively. Thus, we observe a consistent trend for outbursts from low-mass stars and BDs, where higher αMRI values are associated with shorter event durations and intervals between successive events.
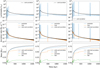 |
Fig. 10 Luminosity of the central object, accretion rate onto the sink and protostar, and the masses of the protostar, IAD, and sink (i.e., protostar + IAD mass) (top to bottom row) for runs 8–10 (left to right column); see also Table 3. The black line shows the luminosity, the accretion rate onto the sink and its mass for run 11. |
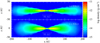 |
Fig. 11 Cross section of the density on the x − ɀ plane showing the disk (edge-on view) at t = 15 kyr, which forms around the protostar in run 9 (episodic accretion; top) and in run 11 (continuous accretion; bottom). |
5.3 Episodic accretion during the main accretion phase of low-mass star formation
In Figure 14, we illustrate the duration of the main accretion phase as a function of αMRI for the forming protostars. To ensure consistency in our comparison between the formation of proto- BDs and low-mass protostars, we apply the same criteria to define the main accretion phase as used in the proto-BD simulations. For αMRI = 0.1, the main accretion phase is the longest, while for αMRI = 0.01, the shortest. Additionally, across all values of αMRI, the episodic accretion models (runs 8–10) exhibit a longer main accretion phase than the continuous accretion model (run 11), which is the opposite of what seen in the BD formation simulations (see Fig. 8).
In Figure 15, we show the sink mass at the end of the main accretion phases in relation to the time of the last episodic event, for runs 8–10. Notably, sink particles in the episodic accretion models accumulate more mass when the final episodic event occurs earlier. Moreover, in the continuous accretion simulation (run 11) the sink accretes more mass overall compared to the sink in the episodic accretion simulations (runs 8–10). In Table 4 we summarize our results. We conclude that episodic accretion, accompanied by radiative outbursts, leads to lower gas accretion than continuous accretion, similar to what is observed in BD formation.
A notable difference between proto-BDs and low-mass stars can be seen by comparing the sink accretion rates in the episodic and continuous cases (black vs orange lines) in Figs. 1 and 10 (middle row). In contrast to BD formation, for low-mass star formation, following the last outburst, the accretion rate onto the sink swiftly converges into the one of the continuous accretion case. We see that the effect of episodic outbursts is more prominent in BD-mass cloud cores than in more massive cloud cores, presumably due to the lower gravitational potential energy of the BD-mass cores.
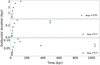 |
Fig. 12 Effect of increasing αMRI on the duration of episodic outbursts for runs 8–10; see also Table 3. |
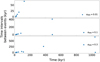 |
Fig. 13 Effect of increasing αMRI on the time intervals between successive episodic outbursts for runs 8–10; see also Table 3. |
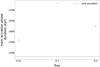 |
Fig. 14 Duration of the main accretion phase for runs 8–11; see also Table 3. The black horizontal dashed line corresponds to run 11 (continuous accretion). |
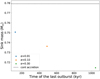 |
Fig. 15 Sink mass at the end of the main accretion phase versus time of the last outburst for runs 8–11; see also Table 3. The black horizontal dashed line corresponds to run 11 (continuous accretion). |
Summary of episodic accretion effects on low-mass star formation.
6 Discussion
The MRI viscosity αMRI is a free parameter in our models, but its value is uncertain. Therefore, observations of outburst- ing proto-BDs and protostars are needed in order to constrain it. In Figures 1 and 10, the models for αMRI = 0.3 result to maximum outburst luminosities reaching ~103 L⊙ and ~104 L⊙, respectively. Vorobyov et al. (2021) presented the main characteristics of observed FUors and FUor-like objects (see Vorobyov et al. 2021, Table A.1.); since there are no observed outbursts with ≥103 L⊙, values of αMRI ≥ 0.3 are probably unlikely. Values of αMRI ~ 0.1 result predominantly to luminosities ~101 L⊙, ~102 L⊙ and outbursts duration on the order of ~101 yr, ~102 yr for proto-BDs and protostars, respectively, providing a better agreement with the observations. We note though that if outbursts with luminosities ≥ 103 L⊙ do occur, then their duration is < 20 yr (see Figs. 4 and 12), and therefore statistically difficult to be observed.
Riaz & Bally (2021) presented a near-infrared study of accretion and outflow activity in six proto-BDs. The bolometric luminosity, of their targets is in the range ~0.03–0.09 L⊙ and was used to derive mean accretion rates, which vary from ~10−6 to ~10−8 M⊙ yr−1. In the brown dwarf formation simulations, we notice that the last episodic event separates the evolution into high-accretion and low-accretion phases, notably for models 1 and 2, see Fig. 1. This pattern is not apparent in low-mass star formation simulations, as the initial cloud core is more massive. During the high accretion phase, the accretion rate onto the proto-BD, ṀIAD, ranges from ∼10−5 to ∼10−6 M⊙ yr−1, whereas during low-accretion from ∼10−7 to ∼10−9 M⊙ yr−1. The high- accretion period is short (≤10–17 kyr), making it statistically more difficult to observe. In contrast, it is plausible that we will frequently observe low-accretion rates, since low-accretion periods last longer. Machida et al. (2009) reach to a qualitatively similar conclusion.
6.1 ISO-OPH 200: a possible outbursting proto-BD
A detailed physical and chemical modeling of the ALMA observations for ISO-Oph 200 was conducted by Riaz & Machida (2021). Their observational and model-derived signals are compatible with the predictions of the core collapse model for BD formation (Machida et al. 2009) and they classify this object as a Class 0 proto-BD.
They identify an infalling cloud core that merges onto a circumstellar pseudo-disk and an inner Keplerian pseudo-disk, and they deduced two different outflows from the object; a wideangled low-velocity CO molecular outflow (∼1000 au), and a high-velocity (unresolved) [Fe II] atomic jet, with the former preceding the latter. The spatial scale of the CO outflow is comparable with the size of the cloud/pseudo-disk regions, resulting in the most extended CO molecular outflow identified to date.
Riaz & Machida (2021) estimate a kinematic age for the system, namely, the time since the system began to collapse to form the brown dwarf, of around 6 ± 1 kyr, and a dynamical age for the CO outflow, that is, the time since the outflow was launched by the proto-BD, at roughly 0.6 ± 0.1 kyr.
The presence of two different flows may indicate variable outflow activity. Additionally, the CO outflow’s very young dynamical age, in comparison to the proto-BD system’s kinematic age, implies a recent accretion event resulting in an outburst. This is corroborated by the ALMA CO(2–1) spectrum, which shows a sudden rise in the flux by a factor of ∼20 over just two velocity channels, and the observed spectral shape of a P Cygni profile which is typically seen during accretion bursts (Riaz & Machida 2021).
Our simulations support this argument. More specifically, the kinematic age of the system is consistent with an episodic event occurring in the first few thousand years from the formation of the proto-BD. Furthermore, according to the simulations presented here, the dynamical age of the outflow (∼0.6 kyr) is comparable to what is expected for an outburst duration for αMRI ≲ 0.01. From Fig. 4 we see that the duration of the outbursts for αMRI ∼ 0.01 is on the order of a hundred years, while smaller αMRI will result in even longer outbursts. On the other hand, higher αMRI values lead to outbursts lasting only a few decades, thus they are not consistent with the dynamical age of the observed outflow.
7 Conclusions
We capitalized the semi-analytic models of Zhu et al. (2009, 2010), which have been incorporated into hydrodynamic simulations of star formation by Stamatellos et al. (2011) to study episodic outbursts from proto-BDs. The model has two free parameters: the MRI viscosity parameter αMRI , which regulates how quickly gas flows onto the proto-BD while the MRI is active, and MBGR, which reflects the proto-BD’s quiescent accretion rate when the MRI is dormant. These parameters are weakly restricted and may differ among proto-BDs.
We performed seven hydrodynamical simulations, all starting with an initial cloud mass of Mcloud = 0.09 M⊙, leading to the formation of objects within the brown dwarf mass range. These simulations included one continuous accretion model and six episodic accretion models, where we varied the free parameters, αMRI and MBGR . In addition, we ran four additional simulations using a more massive cloud, Mcloud = 1.0 M⊙, to investigate how episodic accretion affects brown dwarf formation and to examine the key differences and similarities compared to low-mass star formation. Our main conclusions are given below:
The formation timescales for proto-BDs are at least one order of magnitude shorter than for protostars;
During continuous and episodic accretion, the total amount of emitted energy is similar. However, episodic accretion redistributes the total emitted energy, allowing for long periods of low accretion luminosities and short luminosity outbursts. This behaviour is the same for forming proto-BDs and low-mass protostars;
Almost all BD outbursts occur within 20 kyr from the BD formation, whereas the majority of outbursts from low-mass stars occur within 150 kyr. Therefore, BD outbursts are more rare and hence more difficult to observe than outbursts from low-mass stars;
In forming brown dwarfs, episodic accretion results to shorter main accretion phase than continuous accretion. However, the opposite is true in forming low-mass stars. Additionally, higher αMRI leads to a longer main accretion phase for brown dwarfs, but no such trend appears for low-mass stars;
Episodic accretion accelerates mass accretion onto to the forming object during the very early stages of its formation. However, both for brown dwarfs and low-mass stars, we find that episodic accretion results to less massive objects than continuous accretion;
We find a correlation between the object’s mass at the end of the main accretion phase and the timing of the last episodic accretion event. For brown dwarfs, the later this final event occurs, the more massive the forming object is. However, for low-mass stars, we find the opposite trend: the later the final event, the less massive the forming object is;
The effect of episodic outbursts is more prominent in BD- mass cloud cores than in more massive cloud cores. For brown dwarf forming cloud cores, the last outburst essentially splits the evolution into a short high-accretion and a much longer low-accretion phase.
Acknowledgements
We would like to thank the anonymous referee for their constructive review that has helped to improve the paper. BR acknowledges funding from the Deutsche Forschungsgemeinschaft (DFG) – Projekt number RI-2919/2-3. DS acknowledges support from STFC grant ST/Y002741/1.
References
- Audard, M., Ábrahám, P., Dunham, M. M., et al. 2014, in Protostars and Planets VI, eds. H. Beuther, R. S. Klessen, C. P. Dullemond, & T. Henning, 387 [Google Scholar]
- Bae, J., Hartmann, L., Zhu, Z., & Nelson, R. P. 2014, ApJ, 795, 61 [NASA ADS] [CrossRef] [Google Scholar]
- Balbus, S. A., & Hawley, J. F. 1998, Rev. Mod. Phys., 70, 1 [Google Scholar]
- Balsara, D. S. 1995, J. Comput. Phys., 121, 357 [NASA ADS] [CrossRef] [Google Scholar]
- Bate, M. R. 2011, MNRAS, 417, 2036 [CrossRef] [Google Scholar]
- Bate, M. R. 2012, MNRAS, 419, 3115 [NASA ADS] [CrossRef] [Google Scholar]
- Bate, M. R., Bonnell, I. A., Price, N. M., et al. 1995, MNRAS, 277, 362 [NASA ADS] [CrossRef] [Google Scholar]
- Bell, K. R., Lin, D. N. C., Hartmann, L. W., & Kenyon, S. J. 1995, ApJ, 444, 376 [NASA ADS] [CrossRef] [Google Scholar]
- Boley, A. C., Hartquist, T. W., Durisen, R. H., & Michael, S. 2007, ApJ, 656, L89 [NASA ADS] [CrossRef] [Google Scholar]
- Davidson, J. A., Novak, G., Matthews, T. G., et al. 2011, ApJ, 732, 97 [NASA ADS] [CrossRef] [Google Scholar]
- Dunham, M. M., & Vorobyov, E. I. 2012, ApJ, 747, 52 [NASA ADS] [CrossRef] [Google Scholar]
- Dunham, M. M., Allen, L. E., Evans, N. J., II, et al. 2015, ApJS, 220, 11 [Google Scholar]
- Evans, N. J., II, Dunham, M. M., Jørgensen, J. K., et al. 2009, ApJS, 181, 321 [Google Scholar]
- Fischer, W. J., Hillenbrand, L. A., Herczeg, G. J., et al. 2023, in Protostars and Planets VII, eds. S. Inutsuka, Y. Aikawa, T. Muto, K. Tomida, & M. Tamura, Astronomical Society of the Pacific Conference Series, 534, 355 [NASA ADS] [Google Scholar]
- Forgan, D., Rice, K., Stamatellos, D., & Whitworth, A. 2009, MNRAS, 394, 882 [NASA ADS] [CrossRef] [Google Scholar]
- Goodwin, S. P., & Whitworth, A. 2007, A&A, 466, 943 [NASA ADS] [CrossRef] [EDP Sciences] [Google Scholar]
- Herczeg, G. J., Johnstone, D., Mairs, S., et al. 2017, ApJ, 849, 43 [Google Scholar]
- Hubber, D. A., Batty, C. P., McLeod, A., & Whitworth, A. P. 2011, A&A, 529, A27 [NASA ADS] [CrossRef] [EDP Sciences] [Google Scholar]
- Isella, A., Carpenter, J. M., & Sargent, A. I. 2009, ApJ, 701, 260 [Google Scholar]
- Jankovic, M. R., Owen, J. E., Mohanty, S., & Tan, J. C. 2021, MNRAS, 504, 280 [NASA ADS] [CrossRef] [Google Scholar]
- Kadam, K., Vorobyov, E., Regály, Z., Kóspál, Á., & Ábrahám, P. 2020, ApJ, 895, 41 [NASA ADS] [CrossRef] [Google Scholar]
- Kenyon, S. J., Hartmann, L. W., Strom, K. M., & Strom, S. E. 1990, AJ, 99, 869 [Google Scholar]
- King, A. R., Pringle, J. E., & Livio, M. 2007, MNRAS, 376, 1740 [NASA ADS] [CrossRef] [Google Scholar]
- Lee, C. W., Kim, G., Myers, P. C., et al. 2018, ApJ, 865, 131 [Google Scholar]
- Lodato, G., & Rice, W. 2004, MNRAS, 351, 630 [NASA ADS] [CrossRef] [Google Scholar]
- Lomax, O., Whitworth, A. P., Hubber, D. A., Stamatellos, D., & Walch, S. 2014, MNRAS, 439, 3039 [CrossRef] [Google Scholar]
- Lomax, O., Whitworth, A. P., Hubber, D. A., Stamatellos, D., & Walch, S. 2015, MNRAS, 447, 1550 [CrossRef] [Google Scholar]
- MacFarlane, B. A., & Stamatellos, D. 2017, MNRAS, 472, 3775 [NASA ADS] [CrossRef] [Google Scholar]
- Machida, M. N., Inutsuka, S.-I., & Matsumoto, T. 2009, ApJ, 699, L157 [Google Scholar]
- MacFarlane, B., Stamatellos, D., Johnstone, D., et al. 2019a, MNRAS, 487, 5106 [NASA ADS] [CrossRef] [Google Scholar]
- MacFarlane, B., Stamatellos, D., Johnstone, D., et al. 2019b, MNRAS, 487, 4465 [Google Scholar]
- Machida, M. N., & Matsumoto, T. 2012, MNRAS, 421, 588 [NASA ADS] [Google Scholar]
- Mercer, A., & Stamatellos, D. 2017, MNRAS, 465, 2 [NASA ADS] [CrossRef] [Google Scholar]
- Mercer, A., & Stamatellos, D. 2020, A&A, 633, A116 [NASA ADS] [CrossRef] [EDP Sciences] [Google Scholar]
- Mercer, A., Stamatellos, D., & Dunhill, A. 2018, MNRAS, 478, 3478 [NASA ADS] [CrossRef] [Google Scholar]
- Morata, O., Palau, A., González, R. F., et al. 2015, ApJ, 807, 55 [NASA ADS] [CrossRef] [Google Scholar]
- Morris, J. P., & Monaghan, J. J. 1997, J. Comput. Phys., 136, 41 [NASA ADS] [CrossRef] [Google Scholar]
- Offner, S. S. R., Kratter, K. M., Matzner, C. D., Krumholz, M. R., & Klein, R. I. 2010, ApJ, 725, 1485 [Google Scholar]
- Palau, A., Zapata, L. A., Rodríguez, L. F., et al. 2014, MNRAS, 444, 833 [NASA ADS] [CrossRef] [Google Scholar]
- Palla, F., & Stahler, S. W. 1993, ApJ, 418, 414 [Google Scholar]
- Riaz, B., & Bally, J. 2021, MNRAS, 501, 3781 [NASA ADS] [Google Scholar]
- Riaz, B., & Machida, M. 2021, MNRAS, 504, 6049 [NASA ADS] [CrossRef] [Google Scholar]
- Riaz, B., Thompson, M., Whelan, E., & Lodieu, N. 2015, MNRAS, 446, 2550 [NASA ADS] [CrossRef] [Google Scholar]
- Riaz, B., Briceño, C., Whelan, E., & Heathcote, S. 2017, ApJ, 844, 47 [NASA ADS] [CrossRef] [Google Scholar]
- Riaz, B., Machida, M., & Stamatellos, D. 2019, MNRAS, 486, 4114 [NASA ADS] [CrossRef] [Google Scholar]
- Riaz, B., Stamatellos, D., & Machida, M. N. 2024, MNRAS, 529, 3601 [NASA ADS] [CrossRef] [Google Scholar]
- Shakura, N. I., & Sunyaev, R. A. 1973, A&A, 24, 337 [NASA ADS] [Google Scholar]
- Shang, H., Li, Z. Y., & Hirano, N. 2007, in Protostars and Planets V, eds. B. Reipurth, D. Jewitt, & K. Keil, 261 [Google Scholar]
- Shu, F. H., Adams, F. C., & Lizano, S. 1987, ARA&A, 25, 23 [Google Scholar]
- Stamatellos, D., & Whitworth, A. P. 2009, MNRAS, 392, 413 [Google Scholar]
- Stamatellos, D., Whitworth, A. P., Bisbas, T., & Goodwin, S. 2007, A&A, 475, 37 [NASA ADS] [CrossRef] [EDP Sciences] [Google Scholar]
- Stamatellos, D., Whitworth, A. P., & Hubber, D. A. 2011, ApJ, 730, 32 [Google Scholar]
- Stamatellos, D., Whitworth, A. P., & Hubber, D. A. 2012, MNRAS, 427, 1182 [NASA ADS] [CrossRef] [Google Scholar]
- Takakuwa, S., Saito, M., Lim, J., et al. 2012, ApJ, 754, 52 [NASA ADS] [CrossRef] [Google Scholar]
- Vorobyov, E. I., & Basu, S. 2005, ApJ, 633, L137 [NASA ADS] [CrossRef] [Google Scholar]
- Vorobyov, E. I., & Basu, S. 2010, ApJ, 719, 1896 [NASA ADS] [CrossRef] [Google Scholar]
- Vorobyov, E. I., & Basu, S. 2015, ApJ, 805, 115 [NASA ADS] [CrossRef] [Google Scholar]
- Vorobyov, E. I., Elbakyan, V. G., Takami, M., & Liu, H. B. 2020, A&A, 643, A13 [NASA ADS] [CrossRef] [EDP Sciences] [Google Scholar]
- Vorobyov, E. I., Elbakyan, V. G., Liu, H. B., & Takami, M. 2021, A&A, 647, A44 [EDP Sciences] [Google Scholar]
- Werner, M. W., Roellig, T. L., Low, F. J., et al. 2004, ApJS, 154, 1 [NASA ADS] [CrossRef] [Google Scholar]
- Whitworth, A. P., & Stamatellos, D. 2006, A&A, 458, 817 [NASA ADS] [CrossRef] [EDP Sciences] [Google Scholar]
- Zhu, Z., Hartmann, L., & Gammie, C. 2009, ApJ, 694, 1045 [Google Scholar]
- Zhu, Z., Hartmann, L., Gammie, C. F., et al. 2010, ApJ, 713, 1134 [Google Scholar]
All Tables
All Figures
|
Fig. 1 Luminosity of the central object, accretion rate onto the sink and proto-BD, and the masses of the proto-BD, IAD, and sink (i.e., proto-BD + lAD mass) (top to bottom row) for runs 1–3 (left to right column); see also Table 1. The black line shows the luminosity, the accretion rate onto the sink and its mass for run 7. |
| In the text | |
|
Fig. 2 Luminosity of the central object, accretion rate onto the sink and proto-BD, and the masses of the proto-BD, IAD and sink (i.e., proto-BD + lAD mass) for runs 2, 4–6 (top to bottom row); see also Table 1. The black line shows the luminosity, the accretion rate onto the sink and its mass for run 7. |
| In the text | |
|
Fig. 3 Cross section of the density on the x − ɀ plane showing the disk (edge-on view) at t = 15 kyr, which forms around the proto-BD in run 2 (episodic accretion; top) and in run 7 (continuous accretion; bottom). |
| In the text | |
|
Fig. 4 Effect of increasing αMRI on the duration of episodic outbursts for runs 1–3; see also Table 1. |
| In the text | |
|
Fig. 5 Effect of increasing αMRI on the time intervals between successive episodic outbursts for runs 1–3; see also Table 1. |
| In the text | |
|
Fig. 6 Effect of increasing ṀBGR on the duration of episodic outbursts for runs 2, 4–6; see also Table 1. |
| In the text | |
|
Fig. 7 Effect of increasing ṀBGR on the time intervals between successive episodic outbursts for runs 2, 4–6; see also Table 1. |
| In the text | |
|
Fig. 8 Duration of the main accretion phase for runs 1–3, 7; see also Table 1. The black horizontal dashed line corresponds to run 7. The red horizontal dashed line corresponds to the results of Machida et al. (2009). |
| In the text | |
|
Fig. 9 Sink mass at the end of the main accretion phase versus time of the last outburst for runs 1–3, 7; see also Table 1. The horizontal dashed black line corresponds to run 7 (continuous accretion). The red horizontal dashed line corresponds to the results of Machida et al. (2009). |
| In the text | |
|
Fig. 10 Luminosity of the central object, accretion rate onto the sink and protostar, and the masses of the protostar, IAD, and sink (i.e., protostar + IAD mass) (top to bottom row) for runs 8–10 (left to right column); see also Table 3. The black line shows the luminosity, the accretion rate onto the sink and its mass for run 11. |
| In the text | |
|
Fig. 11 Cross section of the density on the x − ɀ plane showing the disk (edge-on view) at t = 15 kyr, which forms around the protostar in run 9 (episodic accretion; top) and in run 11 (continuous accretion; bottom). |
| In the text | |
|
Fig. 12 Effect of increasing αMRI on the duration of episodic outbursts for runs 8–10; see also Table 3. |
| In the text | |
|
Fig. 13 Effect of increasing αMRI on the time intervals between successive episodic outbursts for runs 8–10; see also Table 3. |
| In the text | |
|
Fig. 14 Duration of the main accretion phase for runs 8–11; see also Table 3. The black horizontal dashed line corresponds to run 11 (continuous accretion). |
| In the text | |
|
Fig. 15 Sink mass at the end of the main accretion phase versus time of the last outburst for runs 8–11; see also Table 3. The black horizontal dashed line corresponds to run 11 (continuous accretion). |
| In the text | |
Current usage metrics show cumulative count of Article Views (full-text article views including HTML views, PDF and ePub downloads, according to the available data) and Abstracts Views on Vision4Press platform.
Data correspond to usage on the plateform after 2015. The current usage metrics is available 48-96 hours after online publication and is updated daily on week days.
Initial download of the metrics may take a while.