Open Access
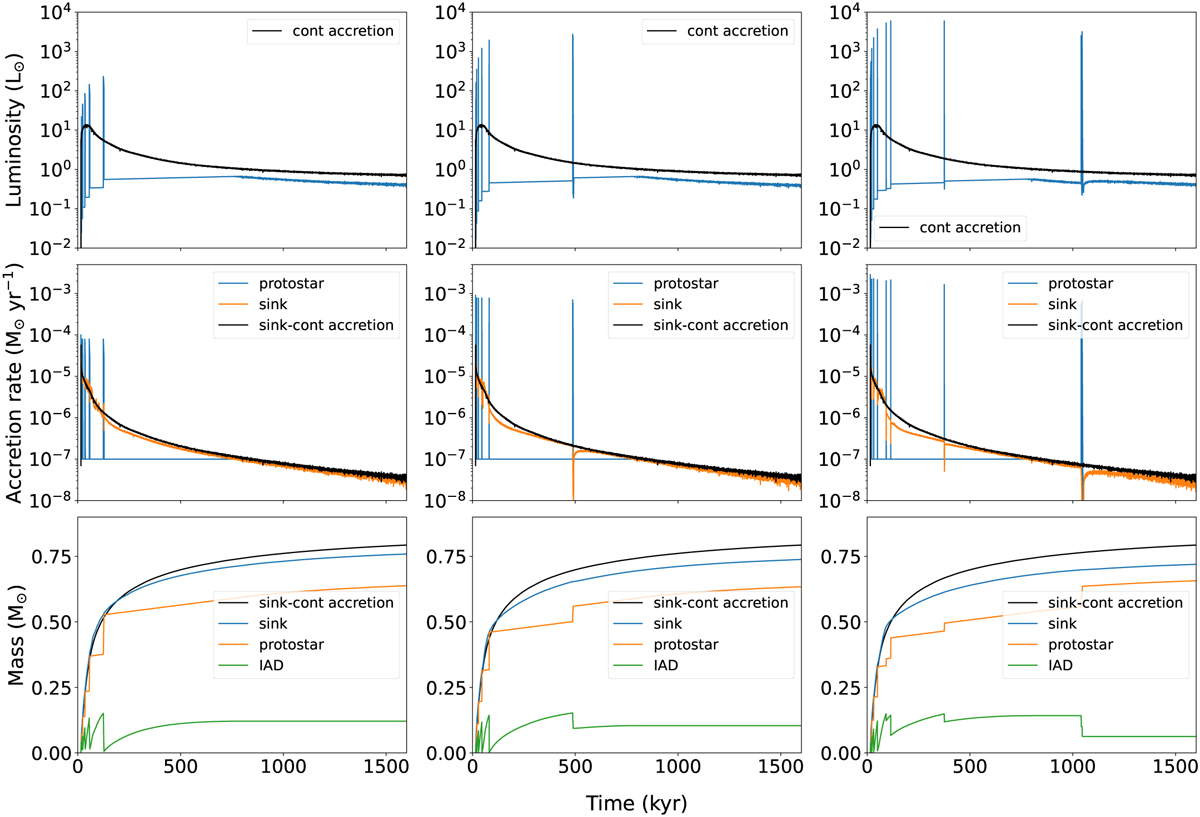
Fig. 10
Download original image
Luminosity of the central object, accretion rate onto the sink and protostar, and the masses of the protostar, IAD, and sink (i.e., protostar + IAD mass) (top to bottom row) for runs 8–10 (left to right column); see also Table 3. The black line shows the luminosity, the accretion rate onto the sink and its mass for run 11.
Current usage metrics show cumulative count of Article Views (full-text article views including HTML views, PDF and ePub downloads, according to the available data) and Abstracts Views on Vision4Press platform.
Data correspond to usage on the plateform after 2015. The current usage metrics is available 48-96 hours after online publication and is updated daily on week days.
Initial download of the metrics may take a while.