Fig. 9.
Download original image
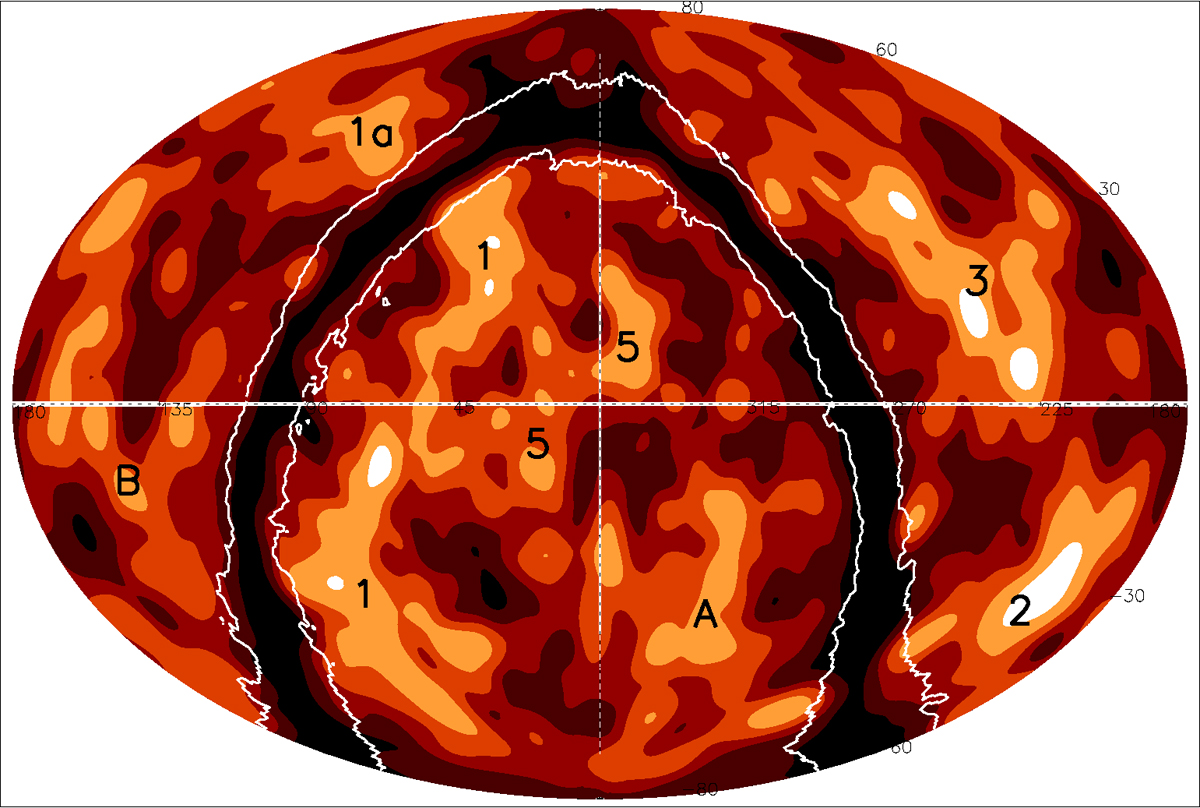
Density map of the 2MASS galaxy distribution in the redshift interval z = 0.03 − 0.06 in equatorial coordinates. The density ratio to the average density is shown by six contour levels: 0–0.23 (black), 0.23–0.62 (dark brown), 0.62–1.13 (middle brown), 1.13–1.9 (light brown), 1.9–3.7 (orange), and > 3.7 (white). The distribution was smoothed with a Gaussian with σ = 3 degrees. The five superstructures are labelled with the number as they appear in Table 1, except that the overlapping structures of 3 and 4 just carry the label 3. The extension of Quipu on the other side of the Zone of Avoidance is labelled 1a. Two more regions showing an enhanced galaxy density are labelled A and B and their identification is discussed in the text. The region around the galactic plane appears black since there are no data on the galaxy distribution in the 2MASS catalogue. The two white lines enclose the region of the ZoA, where the interstellar hydrogen column density is larger than NH ≥ 2.5 × 1021 cm−2.
Current usage metrics show cumulative count of Article Views (full-text article views including HTML views, PDF and ePub downloads, according to the available data) and Abstracts Views on Vision4Press platform.
Data correspond to usage on the plateform after 2015. The current usage metrics is available 48-96 hours after online publication and is updated daily on week days.
Initial download of the metrics may take a while.