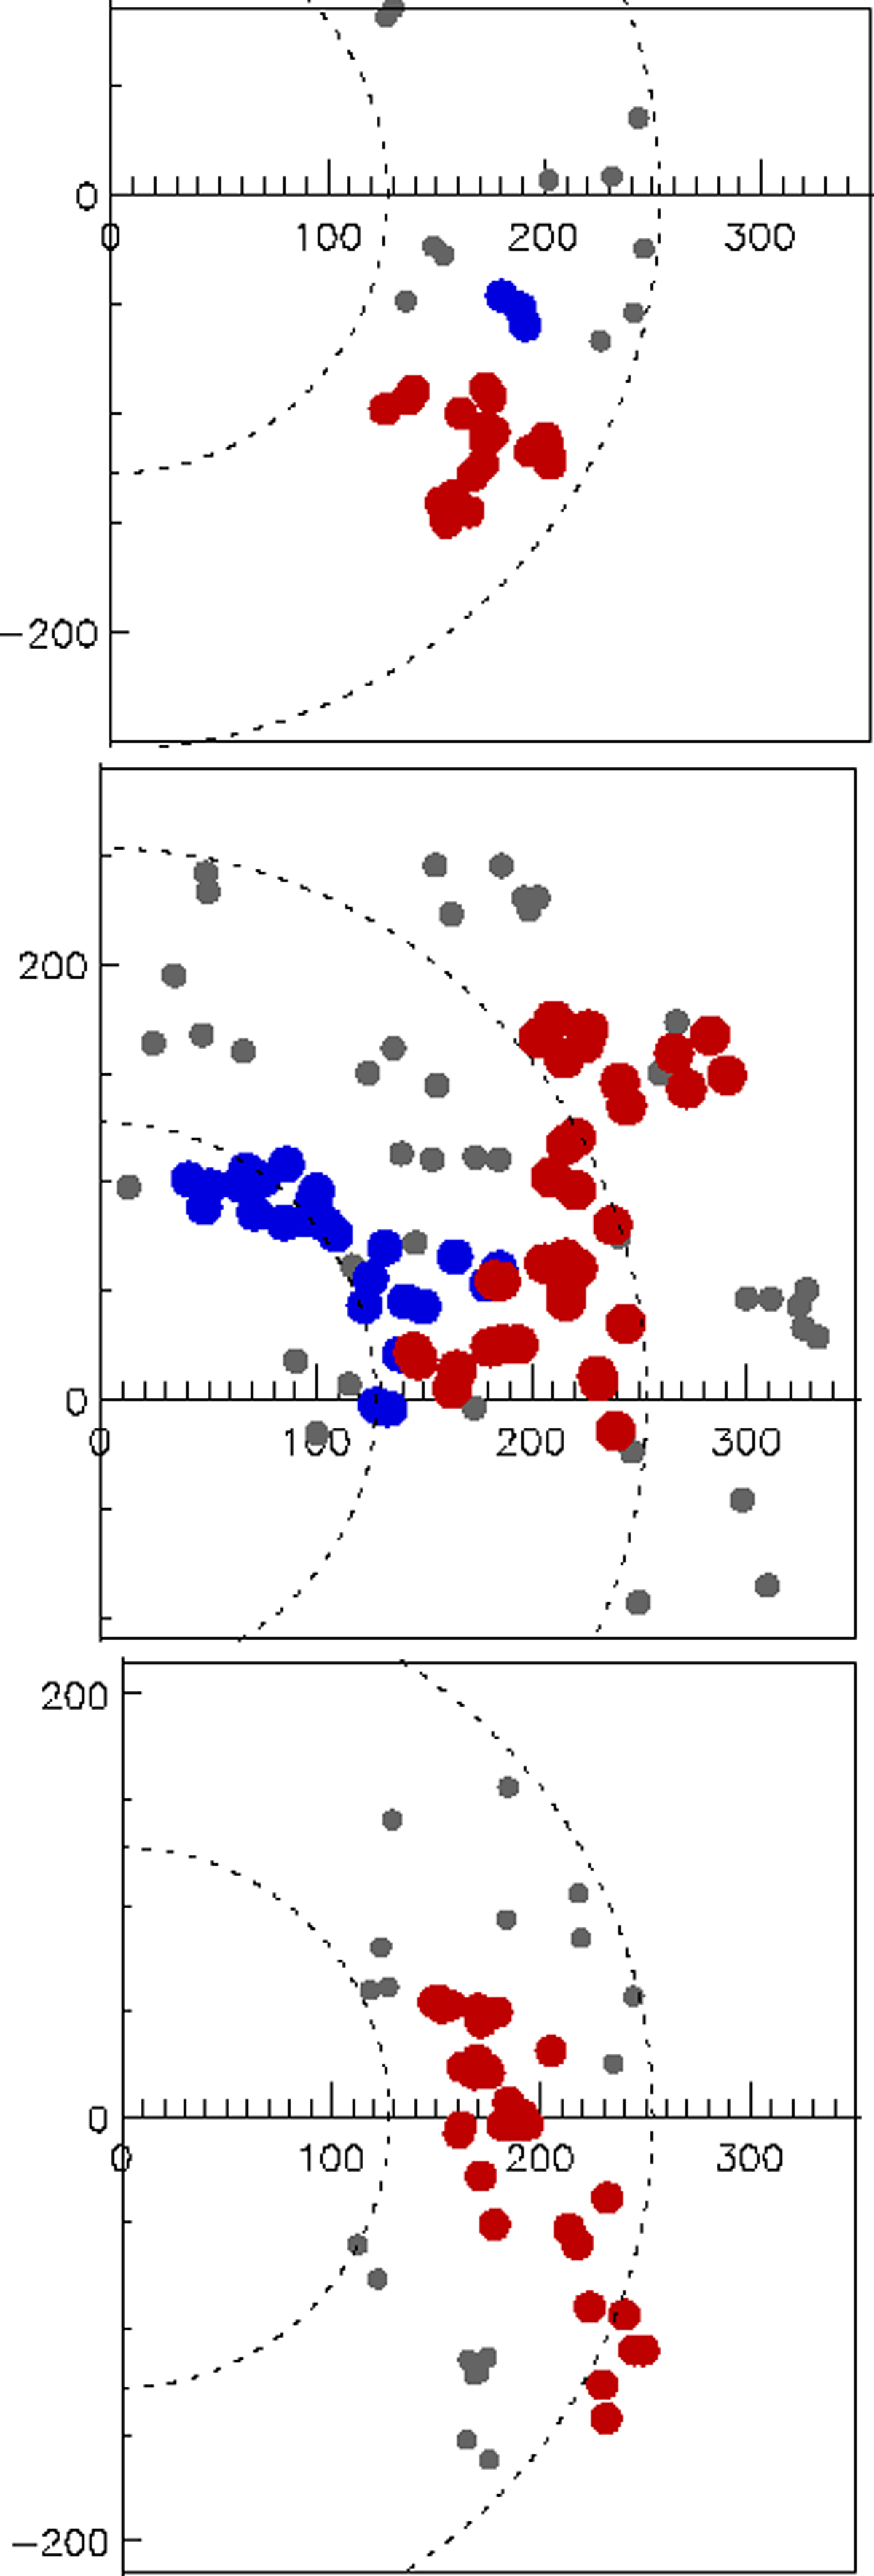
Fig. 7.
Download original image
Four of the superstructures shown in declination-redshift diagrams. The distance units are in Megaparsec and the two dotted lines show the redshift distance z = 0.03 and 0.06. Top: Shapley supercluster shown by red dots. Grey points show the non-member clusters in the same redshift range with right ascensions between 190° and 215°. The clusters marked by the three blue dots are linked to the Shapley supercluster for an increased linking length (see text). Middle: Serpens – Corona Borealis, marked in red and Hercules, marked in blue. Grey points show the non-member clusters in the same redshift range with right ascensions between 214.4° and 279°. Bottom: Sculptor-Pegasus superstructure shown by red dots. Grey points show the non-member clusters in the same redshift range with right ascensions between 345.3° and 360° as well as 0° and 30.6°.
Current usage metrics show cumulative count of Article Views (full-text article views including HTML views, PDF and ePub downloads, according to the available data) and Abstracts Views on Vision4Press platform.
Data correspond to usage on the plateform after 2015. The current usage metrics is available 48-96 hours after online publication and is updated daily on week days.
Initial download of the metrics may take a while.