Fig. 6.
Download original image
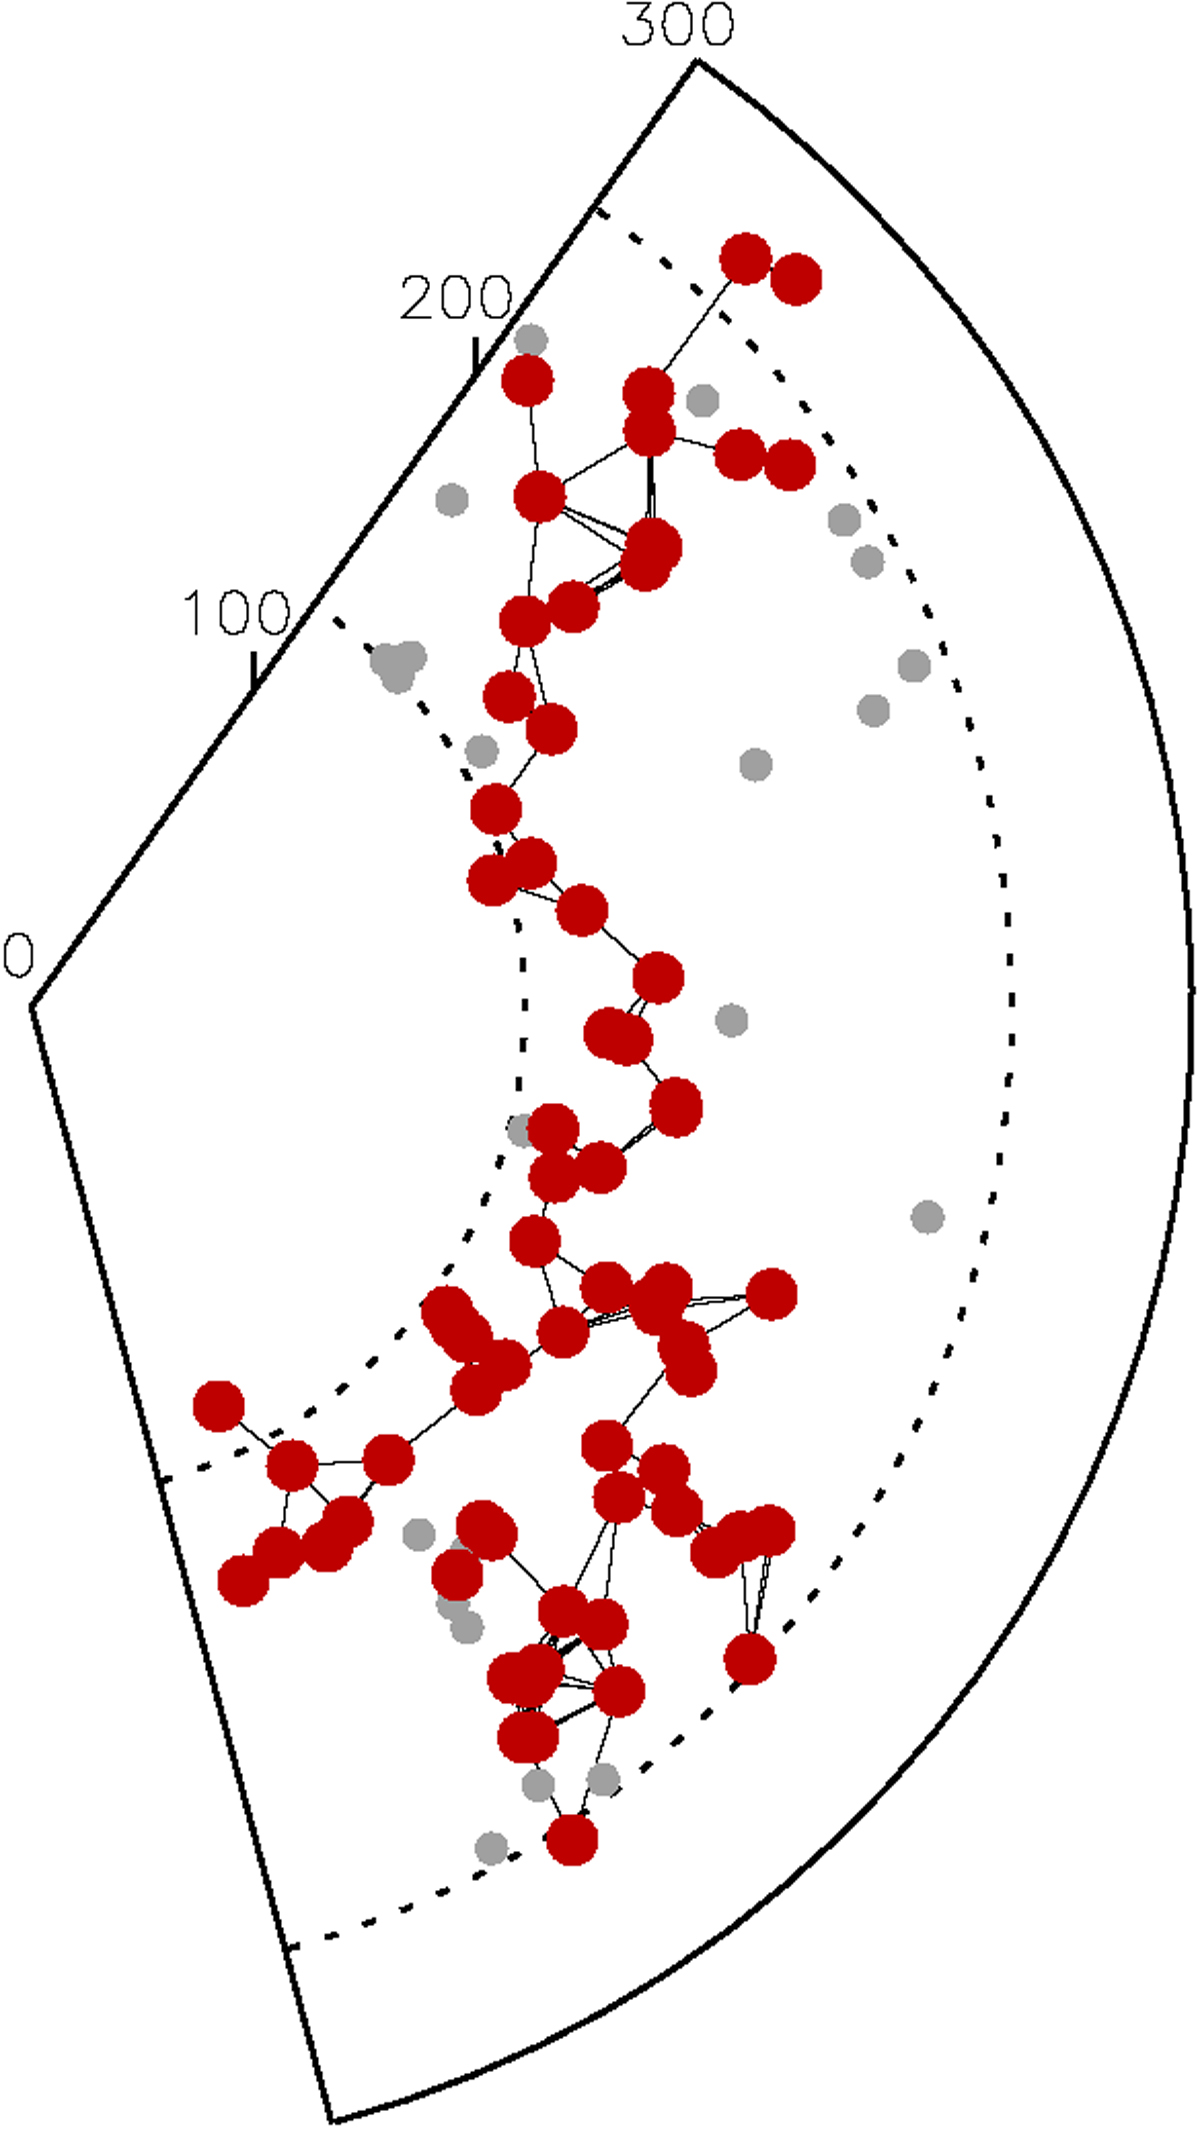
Wedge diagram in declination and distance of the Quipu superstructure. The distance is in units of Megaparsec. The red dots show the superstructure members and the black lines show the friends-to-friends linking. The grey dots show the non-member clusters in the target redshift range and right ascensions between 27.7° and 119.4°. The two dashed lines give the distances for redshifts of 0.03 and 0.06.
Current usage metrics show cumulative count of Article Views (full-text article views including HTML views, PDF and ePub downloads, according to the available data) and Abstracts Views on Vision4Press platform.
Data correspond to usage on the plateform after 2015. The current usage metrics is available 48-96 hours after online publication and is updated daily on week days.
Initial download of the metrics may take a while.