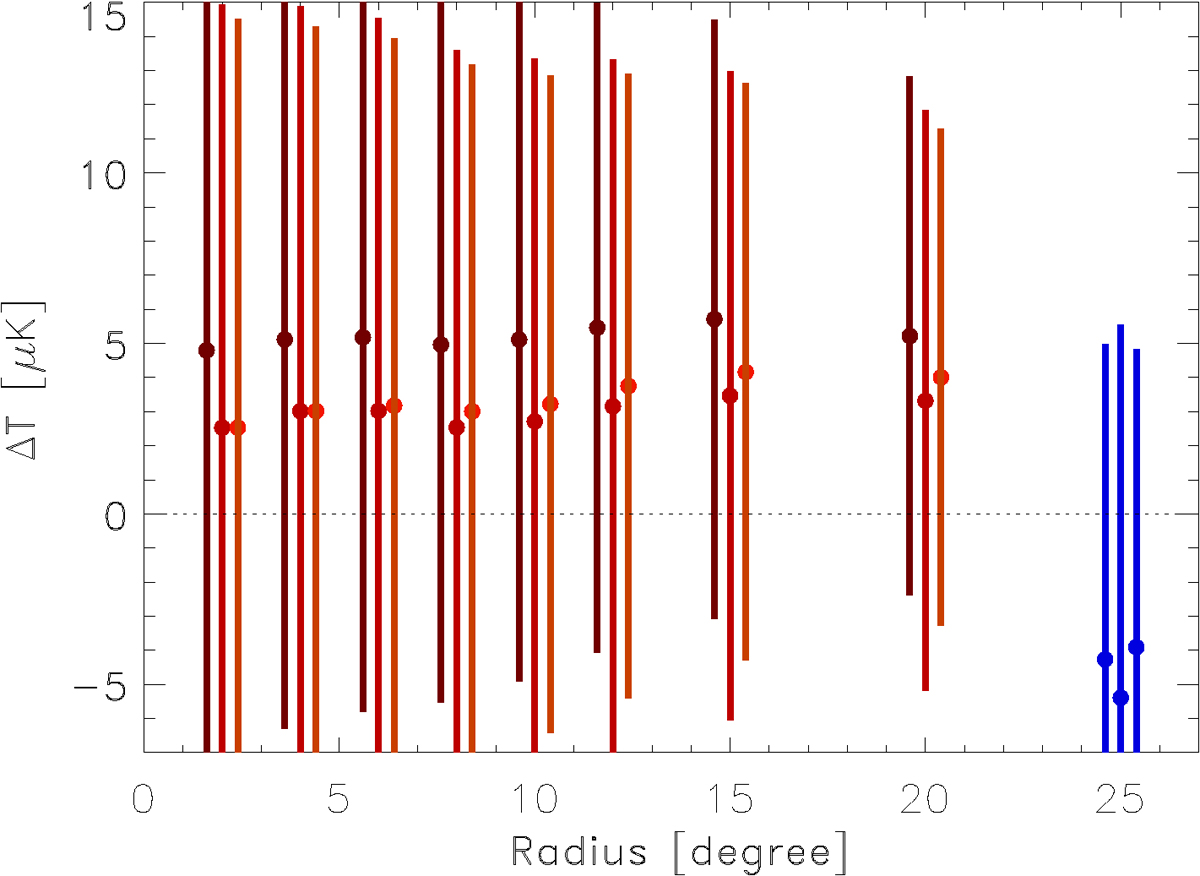
Fig. 20.
Download original image
Integrated Sachs-Wolfe temperature increment in concentric circles around each member cluster of the superstructures. The three data points show the signal from the commander (left offset), nilc (middle) and smica (right offset) analysis codes. The blue points show the signal from the sky region further away from any member cluster than 20 degrees. The error bars indicate 1σ uncertainties.
Current usage metrics show cumulative count of Article Views (full-text article views including HTML views, PDF and ePub downloads, according to the available data) and Abstracts Views on Vision4Press platform.
Data correspond to usage on the plateform after 2015. The current usage metrics is available 48-96 hours after online publication and is updated daily on week days.
Initial download of the metrics may take a while.