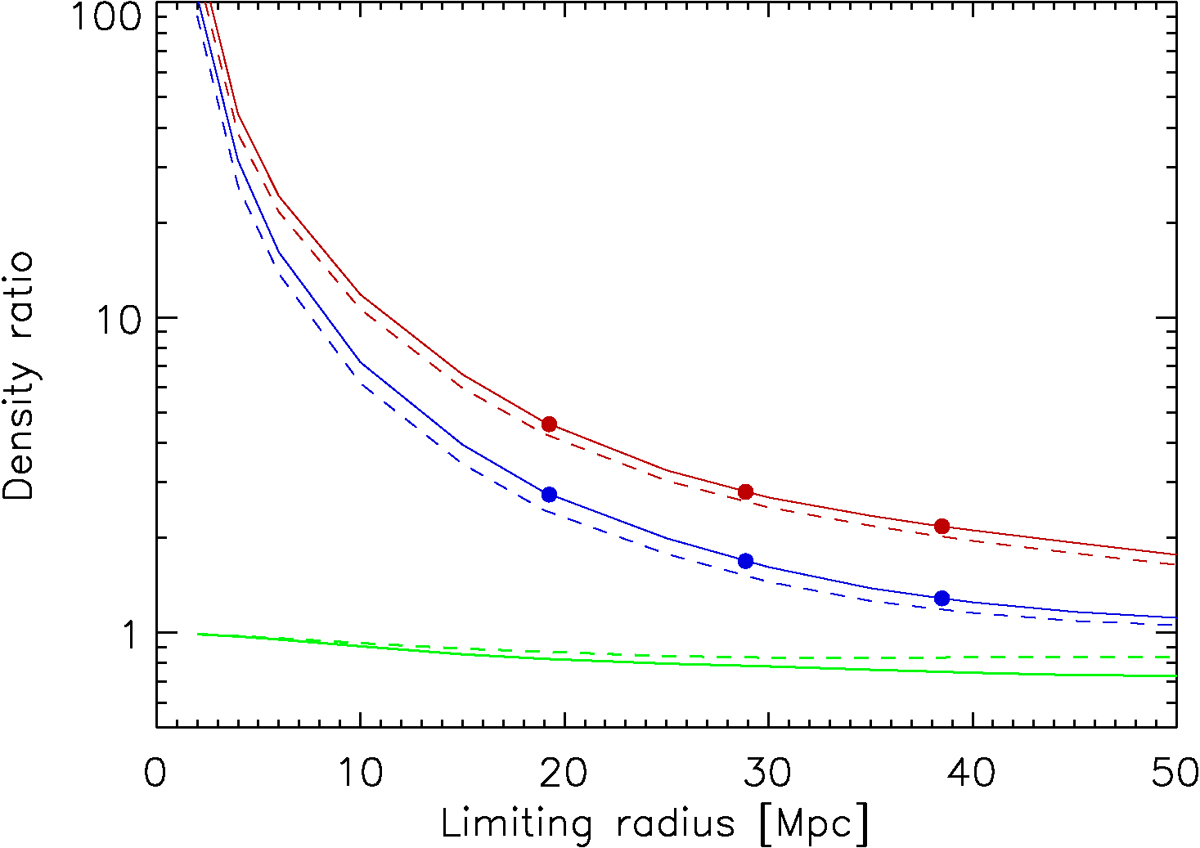
Fig. 12.
Download original image
Density ratio to the mean density of the galaxy density distribution in superstructures (red) and in regions around clusters outside superstructures (blue) as a function of the limiting radius. The solid lines show the results for the total survey volume and the dashed lines the ratio for this volume without the Zone of Avoidance. The radii for which the values are listed in Table 2 are marked with solid points. The green lines show the density ratio to the mean density of the regions outside the superstructures (solid line) and outside the cluster halos of the non-member clusters (dashed lines).
Current usage metrics show cumulative count of Article Views (full-text article views including HTML views, PDF and ePub downloads, according to the available data) and Abstracts Views on Vision4Press platform.
Data correspond to usage on the plateform after 2015. The current usage metrics is available 48-96 hours after online publication and is updated daily on week days.
Initial download of the metrics may take a while.