Fig. 10.
Download original image
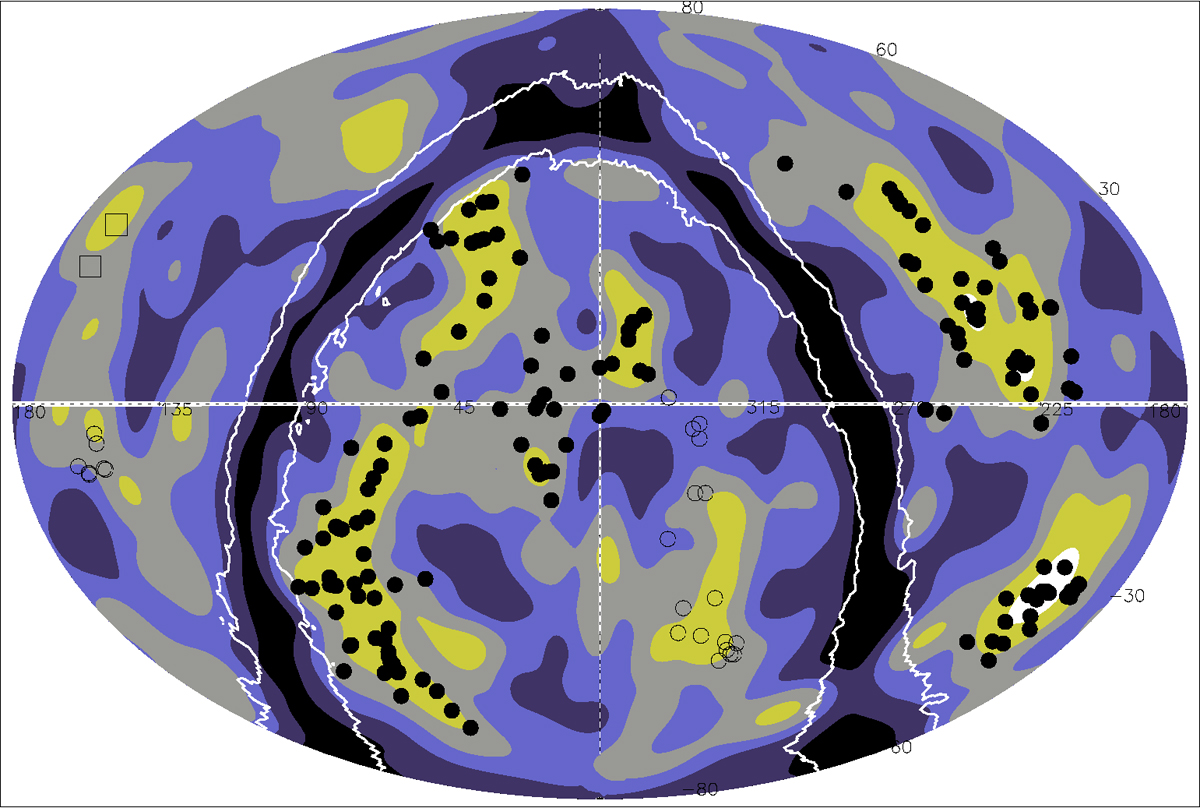
Map of the 2MASS galaxy distribution smoothed with a Gaussian of σ = 4 degrees. The density ratio to the average density is shown by six contour levels: 0–0.23 (black), 0.23–0.62 (dark blue), 0.62–1.13 (light blue), 1.13–1.9 (grey), 1.9–3.7 (olive), and > 3.7 (white). The clusters of the five superstructures are overplotted with filled black circles. The member clusters of two superclusters in region A and one supercluster in region B (as labelled in Fig. 9) are shown with open circles. Two clusters extending into the target redshift range from the Coma supercluster at lower redshift are marked by open squares.
Current usage metrics show cumulative count of Article Views (full-text article views including HTML views, PDF and ePub downloads, according to the available data) and Abstracts Views on Vision4Press platform.
Data correspond to usage on the plateform after 2015. The current usage metrics is available 48-96 hours after online publication and is updated daily on week days.
Initial download of the metrics may take a while.