Fig. 9
Download original image
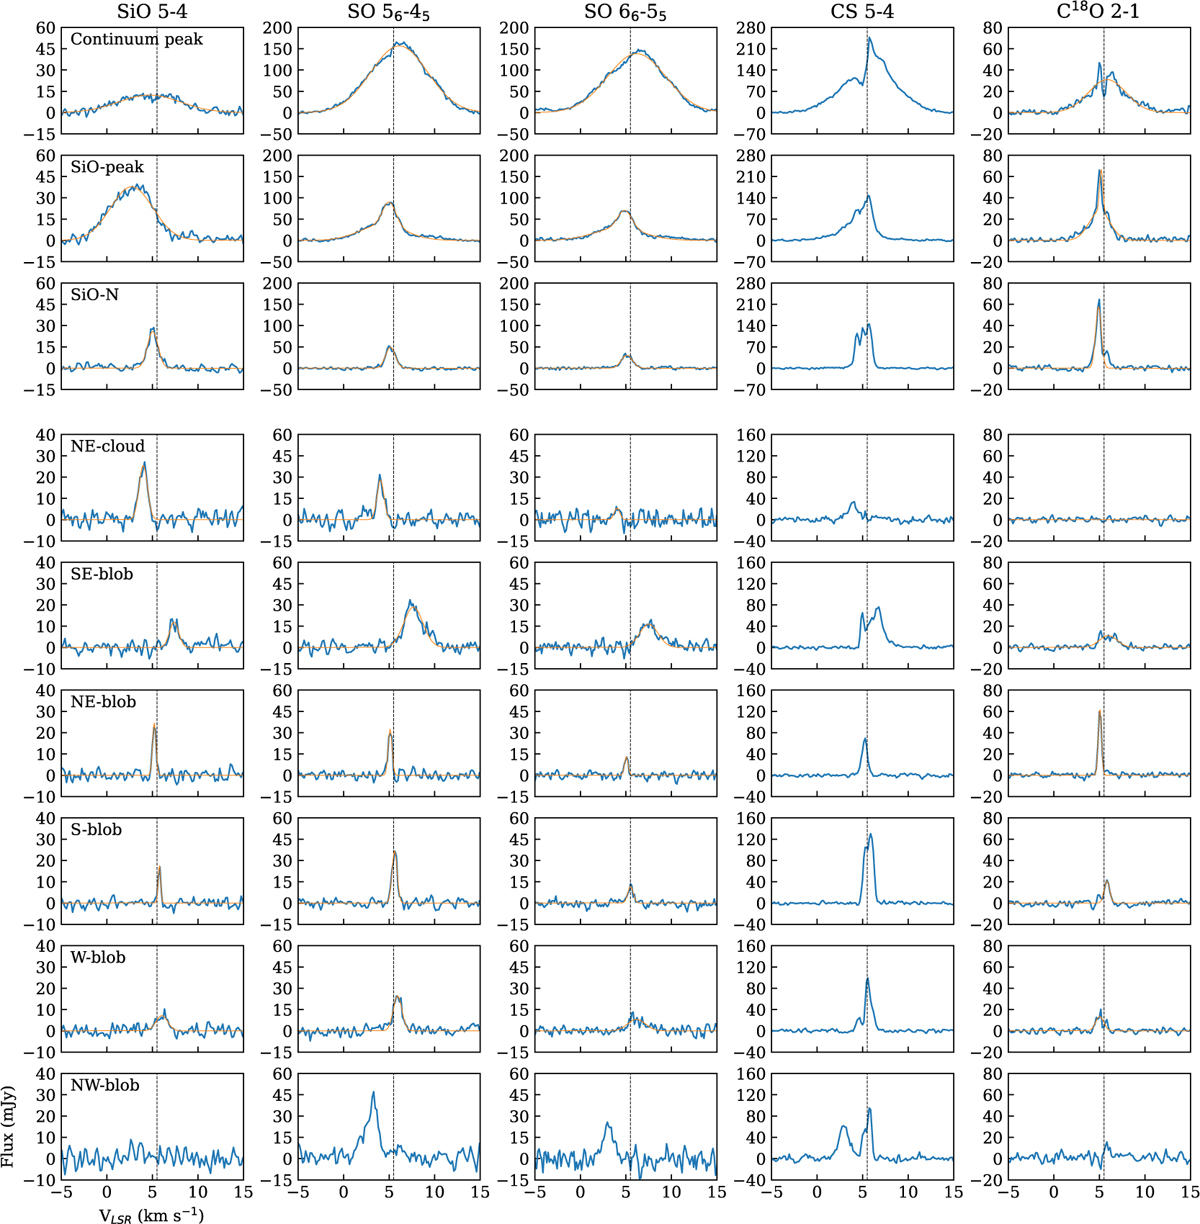
Spectra of all lines integrated over 0.5′′ × 0.5′′ region toward the selected positions (Table 2), as indicated in the moment maps of SiO (Fig. 2). Top 3 panels are the spectra in the central part of L483 while bottom 6 panels show those in the SiO blobs and the NE-cloud region. Considering the different flux levels between the central part (upper 3 rows) and others (lower 6 rows), different plotting ranges are employed. Vertical lines indicate the systemic velocity of VLSR = 5.5 km s−1. Gaussian fitting results are overlaid with thin red curves (Tables C.1–C.3).
Current usage metrics show cumulative count of Article Views (full-text article views including HTML views, PDF and ePub downloads, according to the available data) and Abstracts Views on Vision4Press platform.
Data correspond to usage on the plateform after 2015. The current usage metrics is available 48-96 hours after online publication and is updated daily on week days.
Initial download of the metrics may take a while.