Fig. 4
Download original image
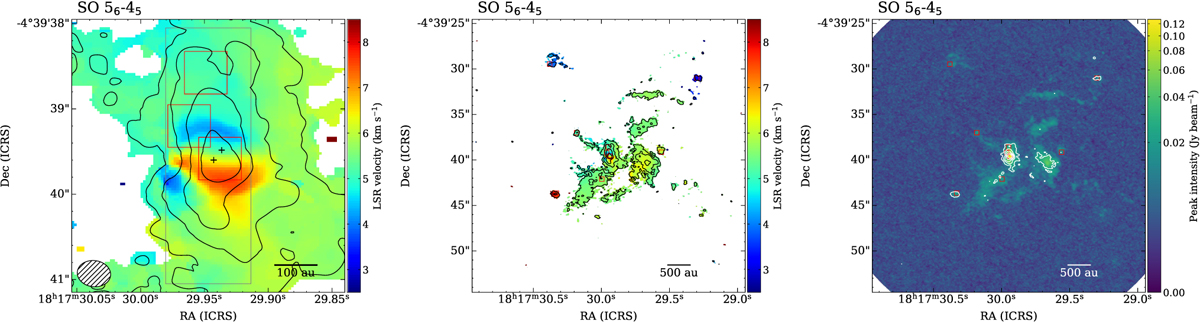
Moment maps of the SO NJ = 56−45 line at 219.949 GHz, same as Fig. 2. Contour levels are 2, 4, 8, and 16 times the rms noise level of 5.02 mJy beam −1 for the maximum intensity (moment 8; left and middle panels) and 2, 4, 8, 16, and 32 times the rms noise level of 17.10 mJy beam−1 km s−1 for the integrated intensity map (moment 0; right panel). We note that the velocity range shown in the color scale is narrower than those of SiO (Fig. 2).
Current usage metrics show cumulative count of Article Views (full-text article views including HTML views, PDF and ePub downloads, according to the available data) and Abstracts Views on Vision4Press platform.
Data correspond to usage on the plateform after 2015. The current usage metrics is available 48-96 hours after online publication and is updated daily on week days.
Initial download of the metrics may take a while.