Fig. 2
Download original image
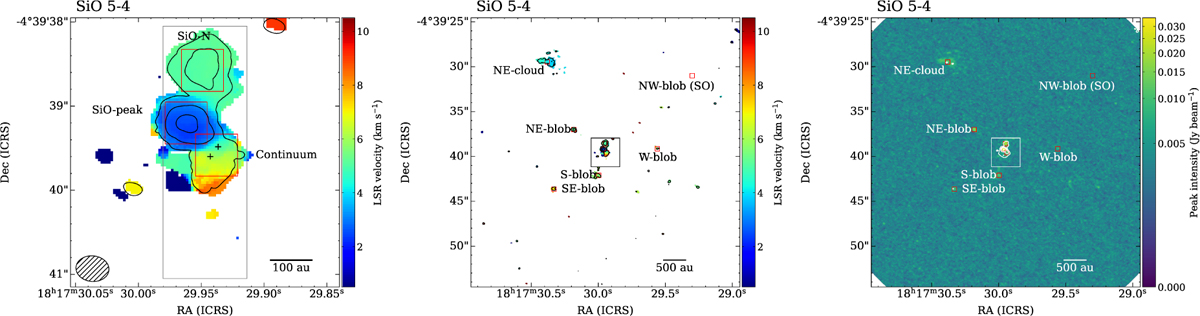
Moment maps of the SiO J =5–4 line at 217.105 GHz of L483. (Left) Maximum intensity (moment 8; black contours) and peak velocity (moment 1; color) maps in the innermost region around the continuum peak. The synthesized beam is shown in the bottom left corner of the image. Contour levels are 2, 4, and 8 times the rms noise level of 3.78 mJy beam−1. The 0.5′′ × 0.5′′ regions where spectra (Fig. 9) have been extracted (Table 2, Fig. A.1) are indicated by red squares. Small black plus signs show the positions of continuum peaks of the binary system (Cox et al. 2022). The rectangular region (1′′ × 3′′) was used to produce the PV diagram in the north-south direction (Fig. 8). (Middle) Same image as is presented in the left panel but showing the larger image size. A black square at the image center indicates the blow-up region for the left panel. We note that the color scales of the moment 1 maps are different from those in Figs. 4–7 in order to clarify the larger velocity width of the SiO line than those of the others. (Right) Integrated intensity (moment 0; white contours) and maximum intensity (moment 8; color) images. Contour levels are 2, 4, 8, and 16 times the rms noise level of 12.67 mJy beam−1 km s−1.
Current usage metrics show cumulative count of Article Views (full-text article views including HTML views, PDF and ePub downloads, according to the available data) and Abstracts Views on Vision4Press platform.
Data correspond to usage on the plateform after 2015. The current usage metrics is available 48-96 hours after online publication and is updated daily on week days.
Initial download of the metrics may take a while.