Fig. A.1
Download original image
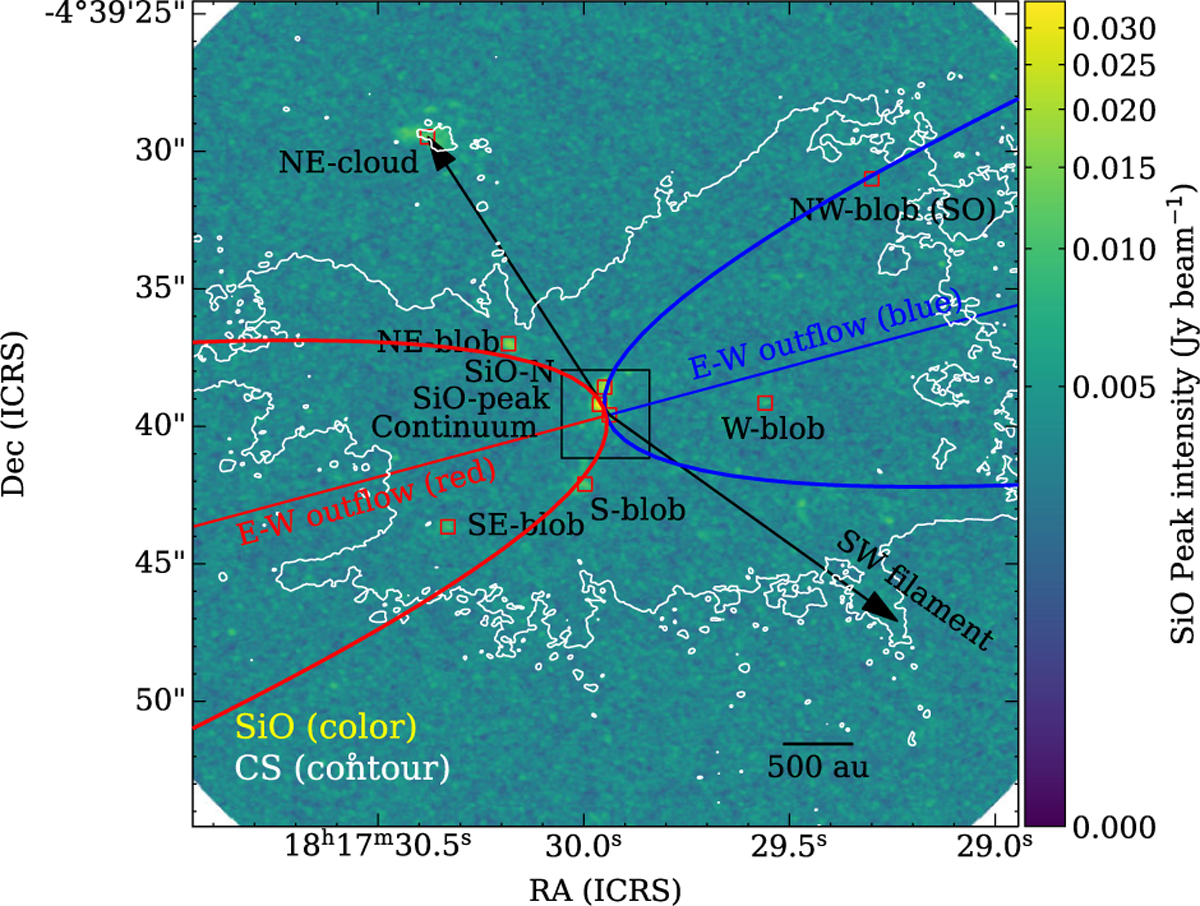
Maximum intensity (moment 8) image of the SiO 5–4 line (color scale). The white contour shows the 2σ level of the maximum intensity of the CS 5–4 line which outlines the E–W outflow lobes (Fig. 6), with the 1 σ noise level of 5.13 mJy beam−1. Positions of specific structures traced by other lines (SO and CS) are also labeled in the panel. Each region listed in Table 2 is indicated by a red square with the size of 0.5′′×0.5′′. The parabolic outflow model (Oya et al. 2018) with a PA of 105 degrees are indicated with solid red and blue lines for the red- and blueshifted lobes, respectively. The arrows indicate the directions toward the NE-cloud and SW filament.
Current usage metrics show cumulative count of Article Views (full-text article views including HTML views, PDF and ePub downloads, according to the available data) and Abstracts Views on Vision4Press platform.
Data correspond to usage on the plateform after 2015. The current usage metrics is available 48-96 hours after online publication and is updated daily on week days.
Initial download of the metrics may take a while.