Fig. 10
Download original image
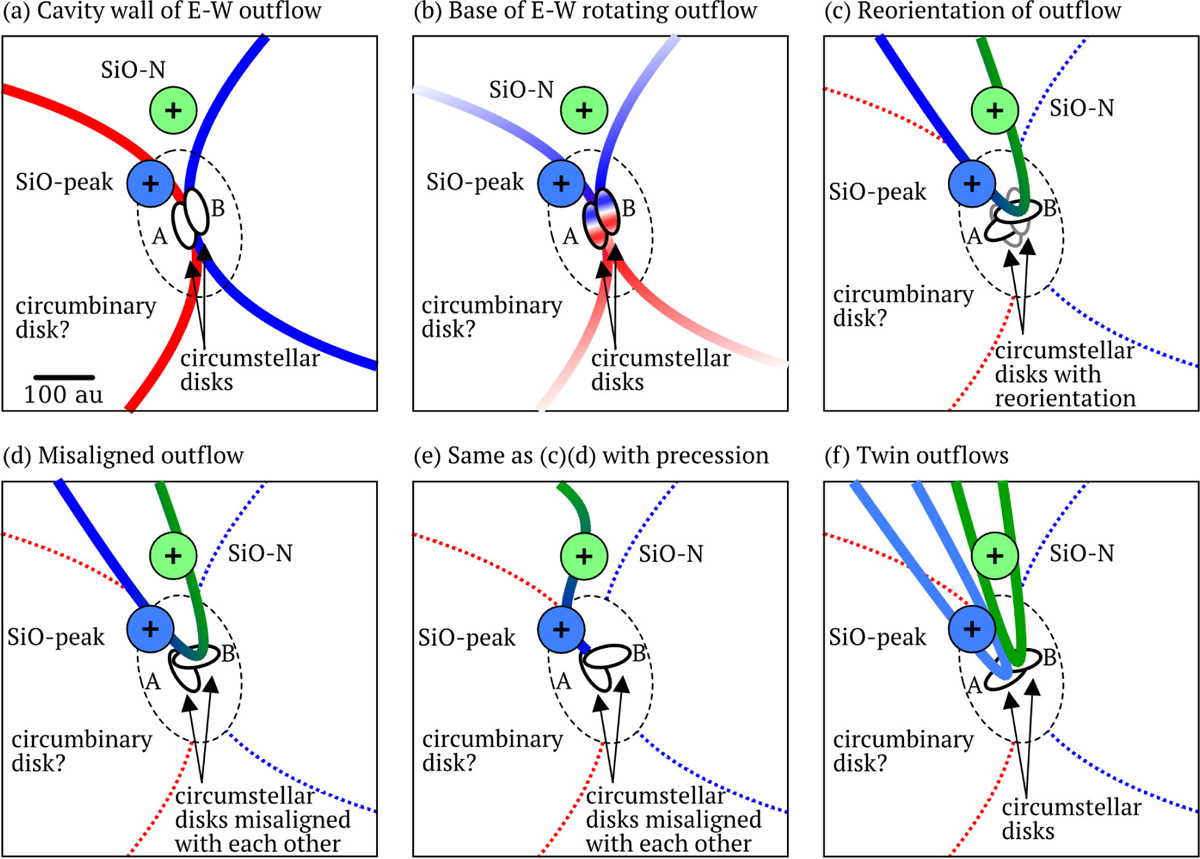
Possible scenarios for outflows in the central region of L483. Each panel shows the same region as in the left panel of Fig. 2 with the image size of 3.2′′×3.2′′(640 au) but the image center is defined as the middle of the two continuum peaks of binary components A and B (Cox et al. 2022). Positions of SiO-peak, SiO-N, two continuum peaks A and B are indicated by crosses. Blue- and redshifted lobes of the parabolic outflow models (Oya et al. 2018) are overlaid with blue and red curves, respectively. Possible configurations of outflows (bold solid or dashed red, blue, and green lines), circumbinary disk (dashed ellipse) and circumstellar disks (small solid ellipses) are also plotted. A scale bar of 100 au is indicated in the top left panel a while sizes and directions (orientation and inclination) of disks and outflows are arbitrary. We note that the circumbinary disk with the diameter of >30 au has not been confirmed yet, as is plotted by a dashed black ellipse (Jacobsen et al. 2019; Cox et al. 2022).
Current usage metrics show cumulative count of Article Views (full-text article views including HTML views, PDF and ePub downloads, according to the available data) and Abstracts Views on Vision4Press platform.
Data correspond to usage on the plateform after 2015. The current usage metrics is available 48-96 hours after online publication and is updated daily on week days.
Initial download of the metrics may take a while.