Fig. 1
Download original image
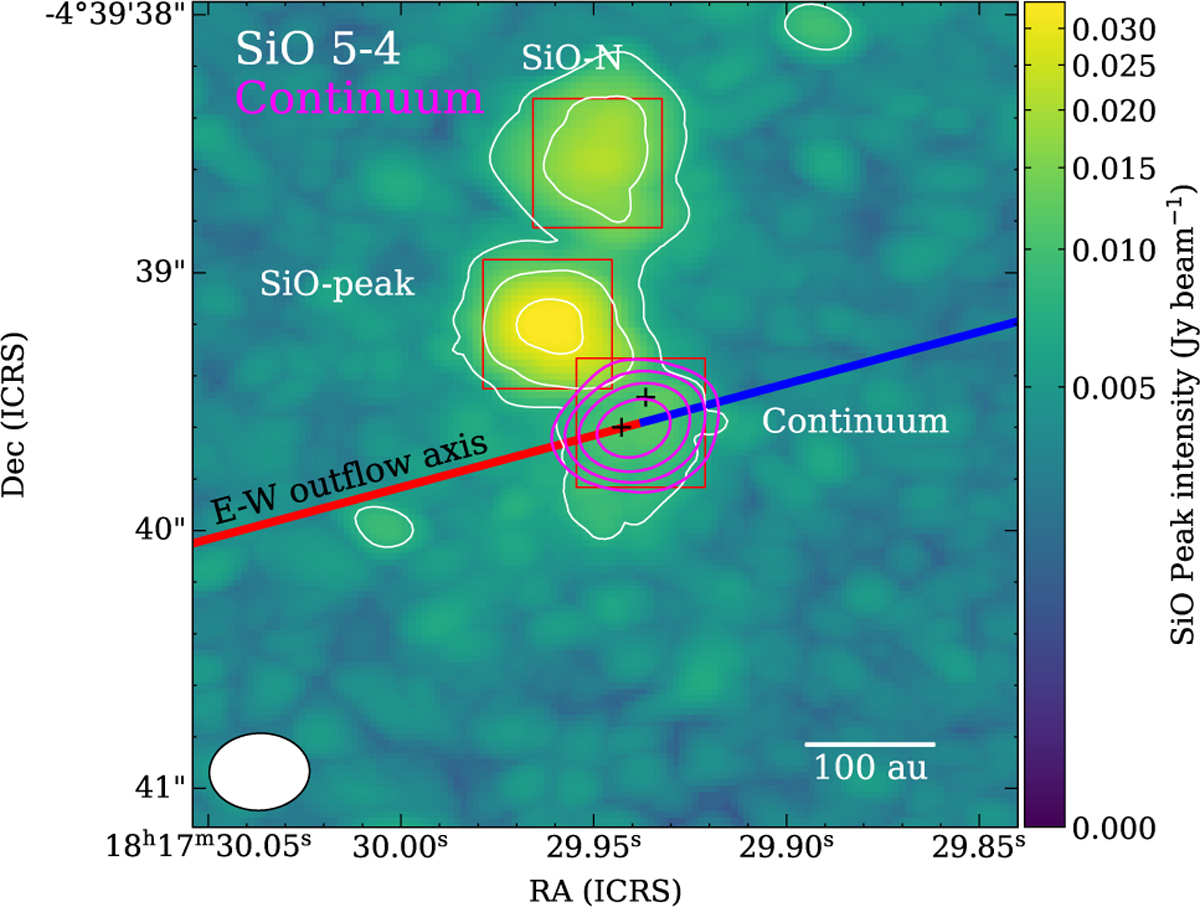
Maximum intensity (moment 8) map of the SiO J=5–4 line at 217.105 GHz (color scale and white contours) and continuum image (setup 1 at 225 GHz; magenta contours) in the innermost region of L483. The moment 8 image was produced using the velocity range of ±10 km s−1 with respect to the systemic velocity of 5.5 km s−1. The synthesized beam is shown in the bottom left corner of the image. Contour levels are 2, 4, and 8 times the rms noise level of 3.78 mJy beam−1 for the maximum intensity and 4, 8, 16, and 32 times the rms noise level of 0.23 mJy beam−1 for the continuum image, respectively. The 0.5′′ × 0.5′′ regions where spectra (Fig. 9) have been extracted (Table 2, Fig. A.1) are indicated by red squares. Small black plus signs show the positions of continuum peaks of the binary system (Cox et al. 2022). The axes of the blue and red lobes of the E–W outflow (Oya et al. 2018) with the PA of 105 degrees are plotted by solid blue and red lines, respectively.
Current usage metrics show cumulative count of Article Views (full-text article views including HTML views, PDF and ePub downloads, according to the available data) and Abstracts Views on Vision4Press platform.
Data correspond to usage on the plateform after 2015. The current usage metrics is available 48-96 hours after online publication and is updated daily on week days.
Initial download of the metrics may take a while.