Fig. 7.
Download original image
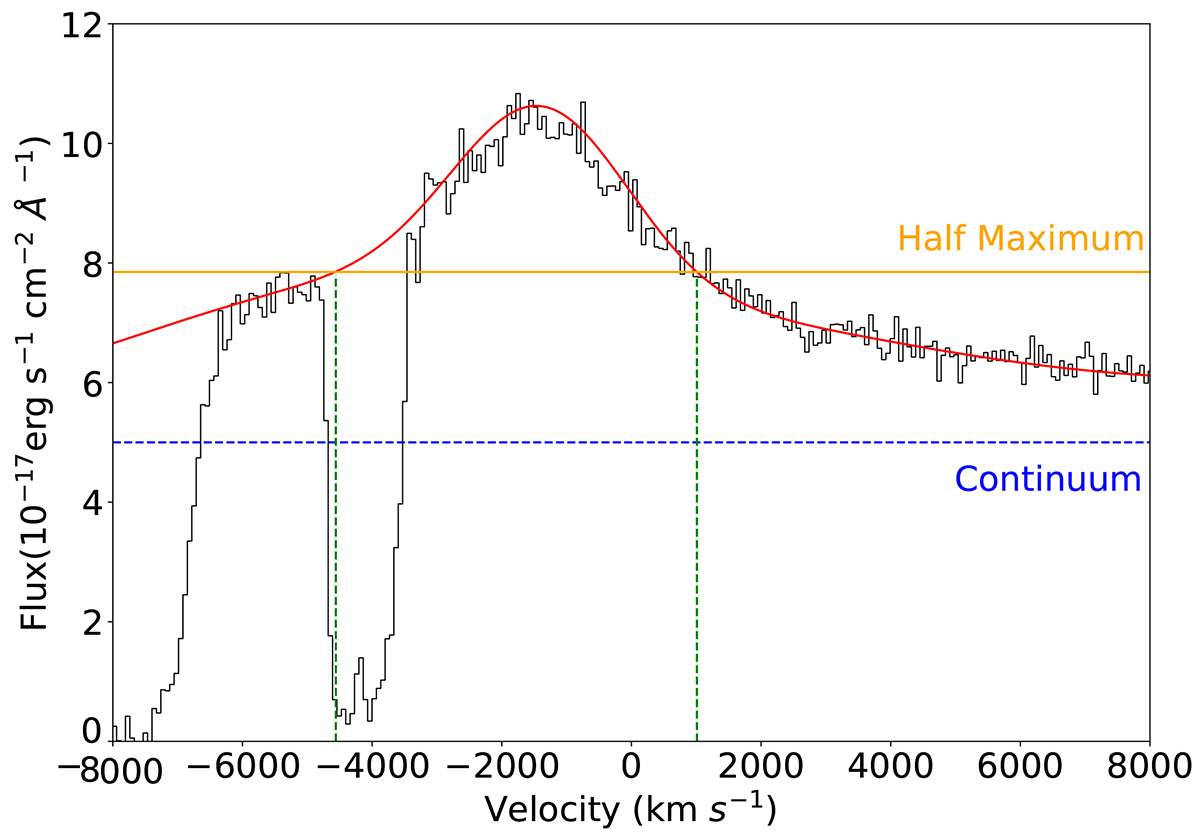
Spectrum in the region around the C IV emission line. The red line shows our total emission model comprised of a continuum fit plus a model for the C IV emission line. The latter is comprised of two Gaussians, one narrow and one broad. The orange line indicates where the half maximum of the emission line model is, while the green dashed lines show the full width of the half maximum. The continuum is subtracted for FWHM determination. We determine a FWHM of 5600 km s−1 and estimate that C IV is blueshifted by about 1500 km s−1.
Current usage metrics show cumulative count of Article Views (full-text article views including HTML views, PDF and ePub downloads, according to the available data) and Abstracts Views on Vision4Press platform.
Data correspond to usage on the plateform after 2015. The current usage metrics is available 48-96 hours after online publication and is updated daily on week days.
Initial download of the metrics may take a while.